

Comment
. 2012 Mar 16;335(6074):1302; author reply 1302.
doi: 10.1126/science.1210484.
Comment on "Widespread RNA and DNA sequence differences in the human transcriptome"
Affiliations
- PMID: 22422963
- PMCID: PMC5207799
- DOI: 10.1126/science.1210484
Item in Clipboard
Comment
Comment on "Widespread RNA and DNA sequence differences in the human transcriptome"
Science.
.
Abstract
Li et al. (Research Articles, 1 July 2011, p. 53; published online 19 May 2011) reported more than 10,000 mismatches between messenger RNA and DNA sequences from the same individuals, which they attributed to previously unrecognized mechanisms of gene regulation. We found that at least 88% of these sequence mismatches can likely be explained by technical artifacts such as errors in mapping sequencing reads to a reference genome, sequencing errors, and genetic variation.
Figures
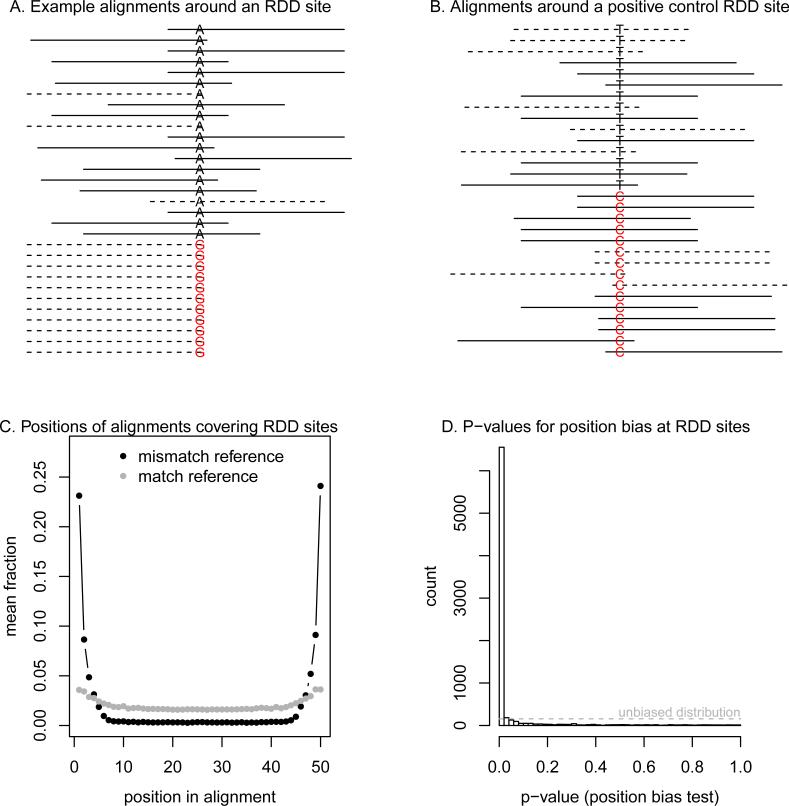
A. RNA-seq read alignments around an RDD call from Li et al. (2011). Plotted are
the positions of read alignments to the genome surrounding the RDD site at
chromosome 11, position 105,473,792. The solid lines show sequencing reads
aligning to the (+) strand of the genome, and dotted lines are alignments to the
(−) strand of the genome. At the center of the plot is the base
corresponding to the RDD site; the reference base is in black, and the
non-reference base is in red, and both are labeled with respect to the (+) DNA
strand. Alignments have been organized such that the mismatches to the genome
are at the bottom of the figure. For plotting, we randomly sampled 20 alignments
that match the genome at the RDD site; all 11 alignments that mismatch the
genome are shown. B. Read alignments around a positive control RDD site. Plotted
are the positions of read alignments to the genome surrounding the known
A→I editing site in AZIN1 [12] (on the forward strand this site appears as
T→C). The format is the same as in A. For plotting, we
randomly sampled 15 alignments that match the genome at the RDD site, and 15
alignments that do not match the genome at the site. C. Position biases in
alignments around RDD sites. For each RDD site with at least five
reads mismatching the genome, we calculated the fraction of reads with the
mismatch (or the match) at each position in the alignment of the RNA-seq read to
the genome (on the + DNA strand). Plotted is the average of this fraction across
all sites, separately for the alignments which match and mismatch the genome. D.
Histogram of p-values for the position bias test. For each RDD site with at
least five reads mismatching the genome, we calculated a p-value for the
position bias test (Supplementary Information). Plotted is the histogram of these
p-values. If these sites were not consistently biased, the distribution of
p-values would be uniform; this is indicated with the dashed grey line.
Comment on
-
Widespread RNA and DNA sequence differences in the human transcriptome.Science. 2011 Jul 1;333(6038):53-8. doi: 10.1126/science.1207018. Epub 2011 May 19. Science. 2011. PMID: 21596952 Free PMC article.
References
Publication types
MeSH terms
Substances
Grants and funding
LinkOut - more resources
Full Text Sources
Other Literature Sources
