. 2007;2(12):e1286.
doi: 10.1371/journal.pone.0001286. Epub 2007 Dec 12.

Predation by bears drives senescence in natural populations of salmon

Affiliations

Predation by bears drives senescence in natural populations of salmon

Stephanie M Carlson et al. PLoS One. 2007.

Abstract

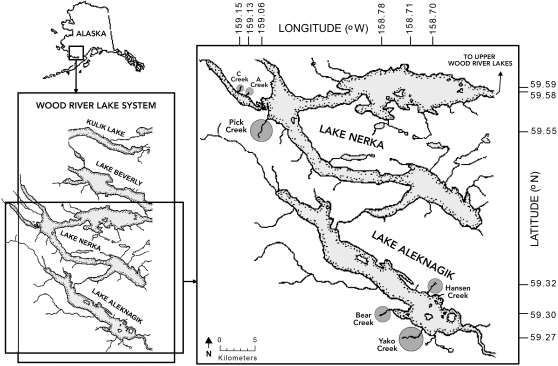
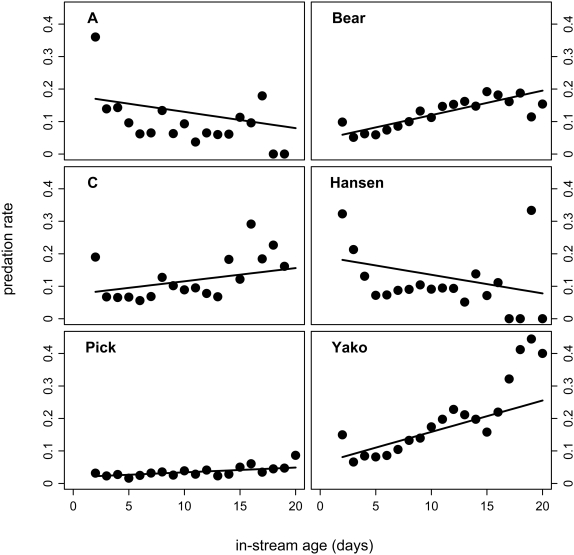
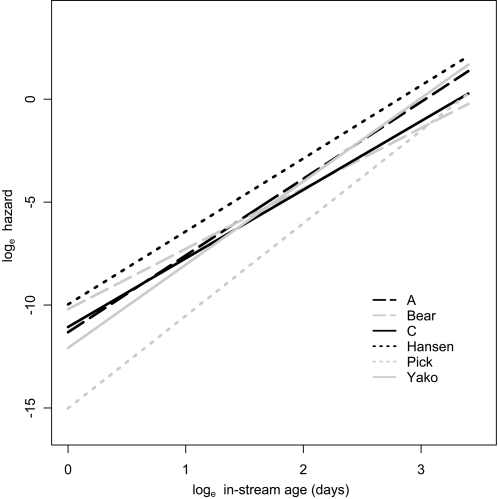
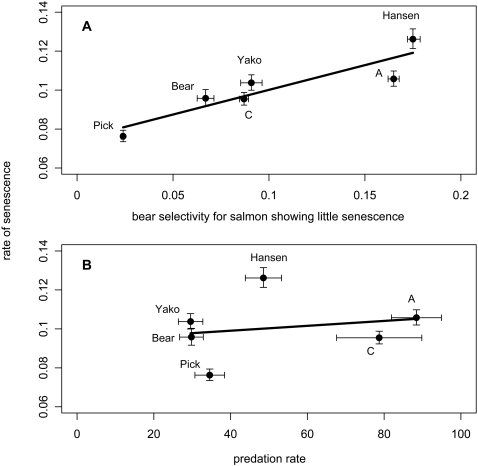
Classic evolutionary theory predicts that populations experiencing higher rates of environmentally caused ("extrinsic") mortality should senesce more rapidly, but this theory usually neglects plausible relationships between an individual's senescent condition and its susceptibility to extrinsic mortality. We tested for the evolutionary importance of this condition dependence by comparing senescence rates among natural populations of sockeye salmon (Oncorhynchus nerka) subject to varying degrees of predation by brown bears (Ursus arctos). We related senescence rates in six populations to (1) the overall rate of extrinsic mortality, and (2) the degree of condition dependence in this mortality. Senescence rates were determined by modeling the mortality of individually-tagged breeding salmon at each site. The overall rate of extrinsic mortality was estimated as the long-term average of the annual percentage of salmon killed by bears. The degree of condition dependence was estimated as the extent to which bears killed salmon that exhibited varying degrees of senescence. We found that the degree of condition dependence in extrinsic mortality was very important in driving senescence: populations where bears selectively killed fish showing advanced senescence were those that senesced least rapidly. The overall rate of extrinsic mortality also contributed to among-population variation in senescence-but to a lesser extent. Condition-dependent susceptibility to extrinsic mortality should be incorporated more often into theoretical models and should be explicitly tested in natural populations.


Conflict of interest statement

Competing Interests: The authors have declared that no competing interests exist.

Figures

Figure 1
Figure 1. Sampling sites within the Wood River Lakes, southwest Alaska, USA.
Figure 2
Figure 2. Population-specific predator selectivity for fish of different in-stream ages.
Shown are proportions of the available fish of a given in-stream age (i.e., individuals that survived to day d) that are killed by bears in each creek. Our estimate of predator selectivity was the average of the predation rates on the first three days in the stream (i.e., the average of the first three points in each panel, see Electronic Supporting Information, Text S1). Note that the probability of being killed decreased within increasing in-stream age in Hansen and A creeks (i.e., bears killed salmon showing little senescence), but increased to varying degrees in Bear, Hansen, Pick, and Yako creeks (i.e., bears killed salmon showing more advanced senescence).
Figure 3
Figure 3. Hazard.
Population-specific hazard functions (y-axis) plotted against in-stream age (x-axis). These functions are based on a mean day of entry and on population-specific day of entry parameters. The higher the hazard for a given in-stream age, the greater the senescence rate at that age. The slopes of these lines represent variation in the shape of the hazard function (α) and the elevation of the lines represent variation in their magnitude given the shape (λ).
Figure 4
Figure 4. Rate of aging.
Senescence rates (ω±95% confidence intervals generated from likelihood profiles, [42]) plotted against (A) predator selectivity for salmon that show little senescence (± SE across the first three days in the stream) and (B) predation rate (± SE across years). For both plots, the line represents the predicted senescence rates from an ordinary-least squares regression.
Figure 5
Figure 5. Photographs showing breeding sockeye salmon in various states.
Panel A shows newly arrived sockeye salmon that show little senescence. Note their bright red coloration. Panel B shows a bear-killed male salmon. Panel C shows a senescent male (top) and female (bottom) salmon. Note their frayed fins, drab coloration, and general emaciated appearance relative to the newly arrived fish. Panel D shows salmon that have stranded in an area of low water (bottom left corner of panel D). Photographs by Ranae Holland (A), Stephanie Carlson (B,C), and Neala Kendall (D).

References

    1. Hamilton WD. The moulding of senescence by natural selection. J Theor Biol. 1966;12:12–45. - PubMed
    1. Baudisch A. Hamilton's indicators of the force of selection. Proc Natl Acad Sci U S A. 2005;102:8263–8268. - PMC - PubMed
    1. Williams WD. Pleiotropy, natural selection, and the evolution of senescence. Evolution. 1957;11:398–411.
    1. Medawar PB. London: H.K. Lewis and Co; 1952. An unsolved problem in biology. p. 24.
    1. Austad SN. Retarded senescence in an insular population of Virginia opossums (Didelphis virginiana). J Zool. 1993;229:695–708.

Publication types