

Review
doi: 10.1016/j.cell.2012.02.021.
Outwitting evolution: fighting drug-resistant TB, malaria, and HIV
Affiliations
- PMID: 22424234
- PMCID: PMC3322542
- DOI: 10.1016/j.cell.2012.02.021
Item in Clipboard
Review
Outwitting evolution: fighting drug-resistant TB, malaria, and HIV
Cell.
.
Abstract
Although caused by vastly different pathogens, the world's three most serious infectious diseases, tuberculosis, malaria, and HIV-1 infection, share the common problem of drug resistance. The pace of drug development has been very slow for tuberculosis and malaria and rapid for HIV-1. But for each disease, resistance to most drugs has appeared quickly after the introduction of the drug. Learning how to manage and prevent resistance is a major medical challenge that requires an understanding of the evolutionary dynamics of each pathogen. This Review summarizes the similarities and differences in the evolution of drug resistance for these three pathogens.
Copyright © 2012 Elsevier Inc. All rights reserved.
Figures
Kinetics of bacterial burden in a mouse model of Tb in the alternative states of acute and chronic infection, antibiotic treatment, latency, and reactivation. In this idealized illustration, after low dose aerosol infection, the bacterial burden increases during an acute phase of infection and plateaus to a chronic infection following the onset of the adaptive immune response. Antibiotic treatment (INH + RIF) reduces burden to an apparent sterile state, which may represent true clearance or alternatively a latent infection that may be reactivated by immunosupression with the iNOS inhibitor aminoguanidine (AG). The bacterial burden during latency is comprised of persister cells that may be the substrate for the emergence of resistant strains.
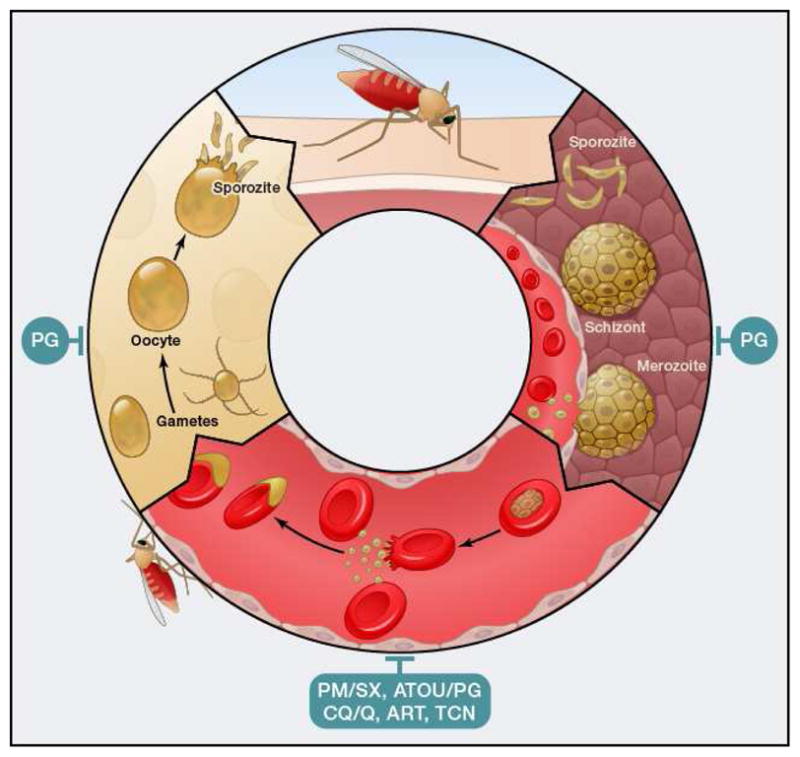
Plasmodium life cycle. Depicted are different stages. Red, intraerythrocytic stages; yellow, mosquito stages; brown, liver stages. PM/SX, pyrimethamine/sulphadoxine; ATOV/PG, atovaquone/proguanil; CQ/Q, 4-aminoquinolines like chloroquine and quinine and related compounds; ART, artemesinin and related compounds; TCN, tetracyclines; PQ, primaquine.
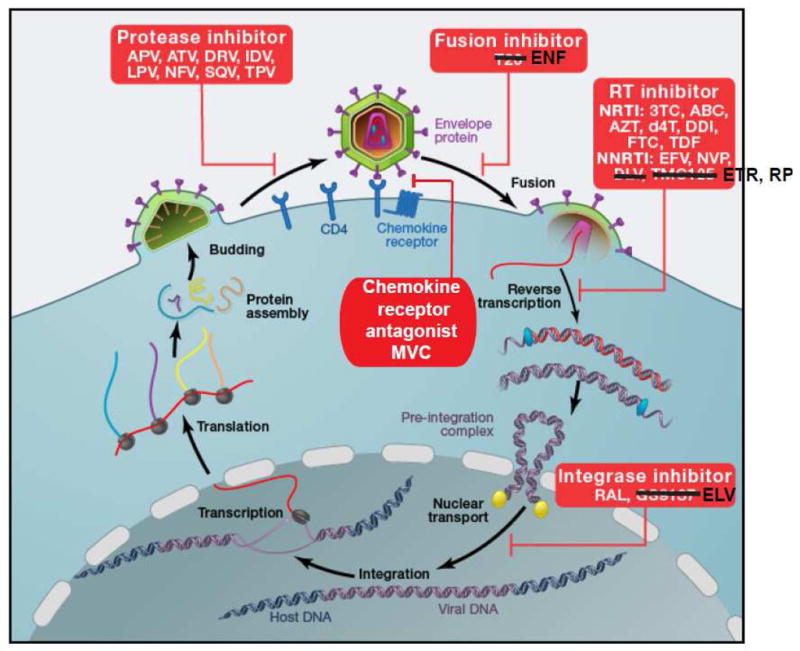
HIV-1 life cycle. HIV-1 attaches to CD4 via envelope protein spikes on the surface of the virion. The CD4 interaction triggers a conformational change in the envelope protein that allows binding to a chemokine receptor, CCR5 or CXCR4. This is followed by further rearrangements of the envelope proteins that mediate fusion of the viral envelope and the cell membrane. The genomic viral RNA is then copied by RT to give double stranded viral DNA that can be inserted into host cell DNA by integrase. Following transcription and translation, viral proteins and genomic viral RNA assemble into virions. During or shortly after release from the virus-producing cell, viral polyproteins are cleaved by HIV-1 protease into functional units, allowing infection of additional cells. Entry can be blocked by the chemokine receptor antagonist (CRA) maraviroc (MVC) or by the fusion inhibitor enfuvirtide (ENF). Reverse transcription is blocked by the NRTIs lamivudine (3TC), abacavir (ABC), zidovudine (AZT), stavudine (d4T), didanosine (ddI), emtricitabine (FTC), and tenofovir disoproxil fumarate (TDF), and by the NNRTIs efavirenz (EFV), nevirapine (NVP), etravirine (ETR), and rilpivirine (RPV). Integration is blocked by the integrase strand transfer inhibitors raltegravir (RAL) and elvitegravir (ELV). Virus maturation is blocked by the PIs amprenavir (APV), atazanavir (ATV), darunavir (DRV), indinavir (IDV), nelfinavir (NFV), saquinavir (SQV) and tipranavir (TPV).
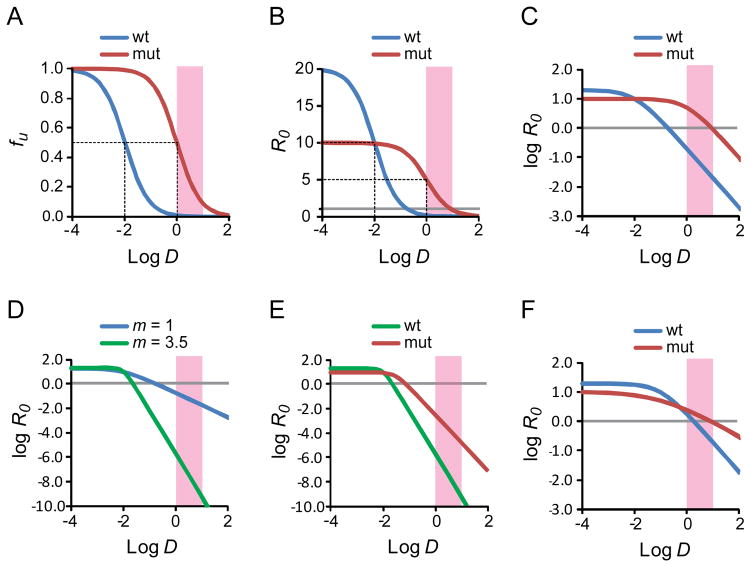
Dose-response curves for antiretroviral drugs. (A) Standard dose-response curve for a hypothetical antiretroviral drug. The fraction of infection events unaffected (fu) by the drug is plotted as a function of the log of the drug concentration (log D) for wild type virus and a resistant mutant. In this example, the IC50 for wild type virus is 0.01 μM and the clinical concentration range is 1–10 μM (pink shaded box). The slope of the dose response curve is 1. The resistance mutation is assumed to increase the IC50 by 100 fold without affecting the slope. The dotted lines indicate the IC50 values for wild type and mutant virus. (B) Dose-response curve for the viruses shown in A with the reproductive ratio R0 as a measure of infection. The resistance mutation is assumed to cause a 50% decrease in fitness. The dotted lines indicate the IC50 values for wild type and mutant virus. The gray line indicates an R0 value of 1. (C) Log-log plot of the dose-response curve shown in B. The gray line indicates an R0 value of 1. (D) Effect of slope. Log-log plot of the dose-response curves for two drugs with the same IC50 (0.01 μM) and m values of 1 (blue curve) and 3.5 (green curve). Note the Y axis scale is expanded to capture the profound in inhibitory effects achieved with a high slope value. The gray line indicates an R0 value of 1. (E) Effect of a single resistance mutation on inhibition by drug with high m. The drug is assumed to have an IC50 of 0.01 uM and a slope of 3.5. A resistance mutations increases the IC50 by 3 fold, reduces the slope by 1/3rd and decreases fitness in the absence of drug by½. Nevertheless, R0 for the mutant virus remains well below 1 throughout the clinical concentration range. (F) Changes in slope can affect resistance. In this example, a drug inhibits both wild type and mutant virus with the same IC50 (0.1 μM). The mutation causes a 50% reduction in fitness but also reduces the slope from 1 to 0.5. Because there is no change in the IC50, standard methods of analysis would not classify the relevant mutation as a resistance mutation. However, in the clinical concentration range, the mutation does cause resistance due to the change in slope.
References
-
- Ahmad Z, Makaya NH, Grosset J. In: Antituberculosis Chemotherapy. Donald PR, Helden PD, Bolliger CT, Karger SAG, editors. Vol. 40. 2011. pp. 1–8.
Publication types
MeSH terms
Grants and funding
LinkOut - more resources
Full Text Sources
Medical
