

The effects of freeze-thaw on β-trace protein and β2-microglobulin assays after long-term sample storage
- PMID: 22425605
- PMCID: PMC3575740
- DOI: 10.1016/j.clinbiochem.2012.02.027
The effects of freeze-thaw on β-trace protein and β2-microglobulin assays after long-term sample storage
Abstract
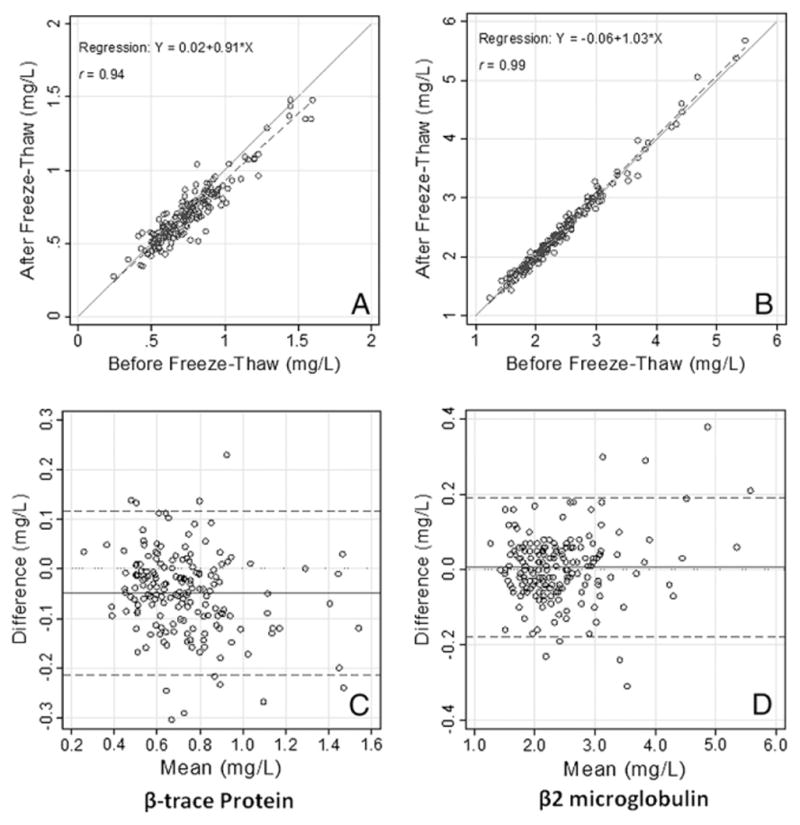
Objectives: To evaluate the effect of a freeze-thaw cycle on β-trace protein (βTP) and β2-microglobulin (β2M).
Design and methods: We compared βTP and β2M concentrations before and after a single freeze-thaw cycle in long-term stored samples from 172 participants of the Third National Health and Nutrition Examination Survey (NHANES III).
Results: Measurements of βTP and β2M before and after freeze-thaw were highly correlated with Spearman's coefficients of 0.90 and 0.99, respectively. Serum concentrations of βTP were slightly lower after freeze-thaw (-0.05 mg/L, P=0.006). Measurements of β2M did not differ before and after freeze-thaw (P=0.35).
Conclusions: βTP and β2M measurements were robust to a single freeze-thaw cycle, although β2M appeared more stable than βTP. These results have implications for future studies of these biomarkers.
Copyright © 2012 The Canadian Society of Clinical Chemists. Published by Elsevier Inc. All rights reserved.
Figures
References
-
- Hoffmann A, Nimtz M, Conradt HS. Molecular characterization of beta-trace protein in human serum and urine: a potential diagnostic marker for renal diseases. Glycobiology. 1997;7:499–506. - PubMed
-
- Ploegh HL, Orr HT, Strominger JL. Major histocompatibility antigens: the human (HLA-A -B -C) and murine (H-2K H-2D) class I molecules. Cell. 1981;24:287–99. - PubMed
-
- Berggård I, Bearn AG. Isolation and properties of a low molecular weight beta-2-globulin occurring in human biological fluids. J Biol Chem. 1968;243:4095–103. - PubMed
-
- Privalov PL. Cold denaturation of proteins. Crit Rev Biochem Mol Biol. 1990;25:281–305. - PubMed
Publication types
MeSH terms
Substances
Grants and funding
LinkOut - more resources
Full Text Sources
Miscellaneous
