Comparative Study
. 2012 May;89(5):602-10.
doi: 10.1097/OPX.0b013e3182504227.

Foveal avascular zone and its relationship to foveal pit shape

Affiliations
Comparative Study

Foveal avascular zone and its relationship to foveal pit shape

Toco Y P Chui et al. Optom Vis Sci. 2012 May.

Abstract

Purpose: To investigate the retinal microvasculature at the fovea and peripheral retina in humans using an adaptive optics scanning laser ophthalmoscope (AOSLO) and to examine the association of foveal avascular zone (FAZ) and foveal pit morphology.

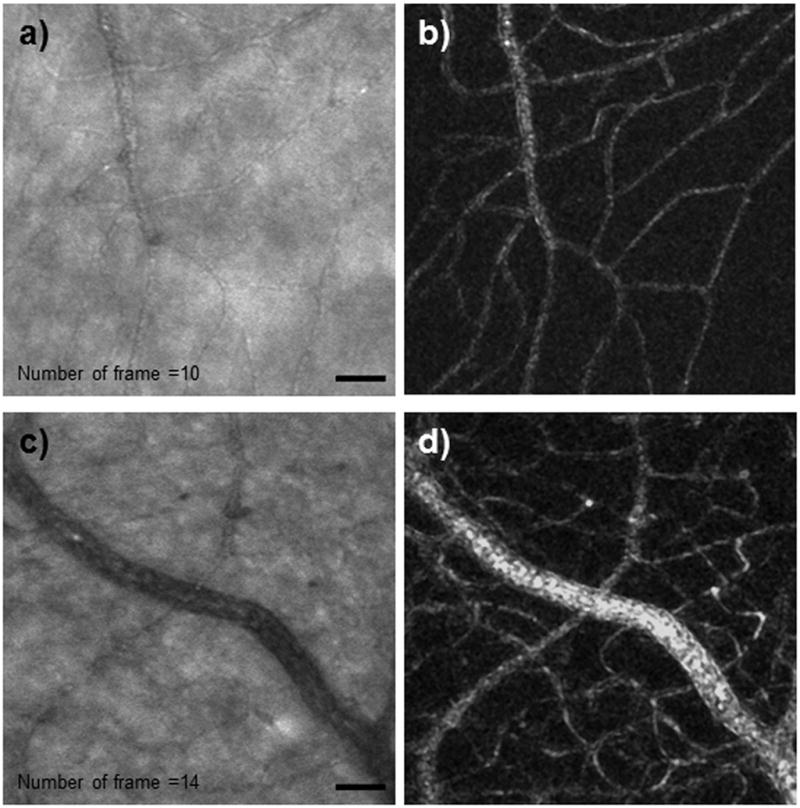
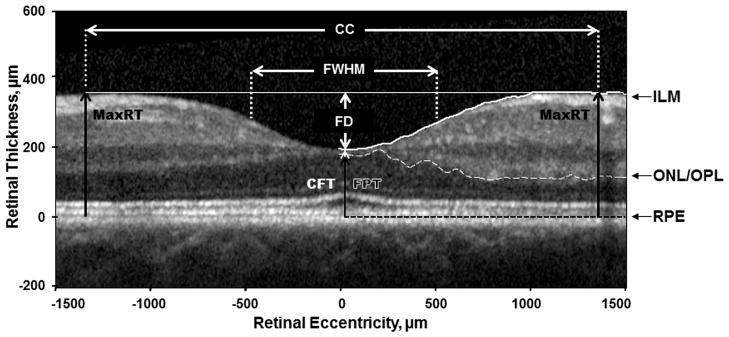
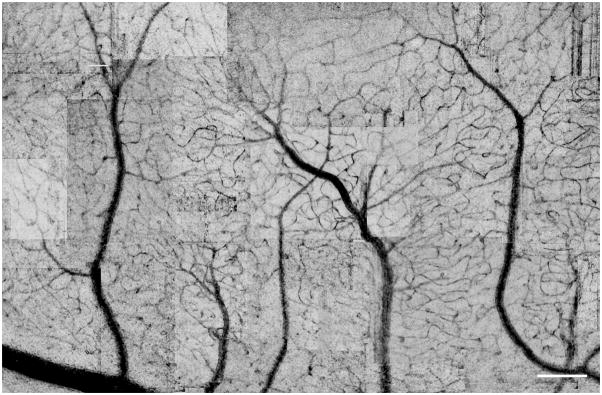
Methods: Retinal imaging of the foveal capillary network was performed on 11 subjects (15 eyes; age range 20 to 54 years) with an AOSLO. Standard deviation maps of the AOSLO images were generated from ∼10 to 30 frames, producing high-resolution maps delineating the complete capillary distribution of the retina. Foveal pit morphology was investigated in the same subjects by using a spectral domain optical coherence tomography. In an additional subject, only a relatively large retinal vasculature map was obtained using AOSLO.

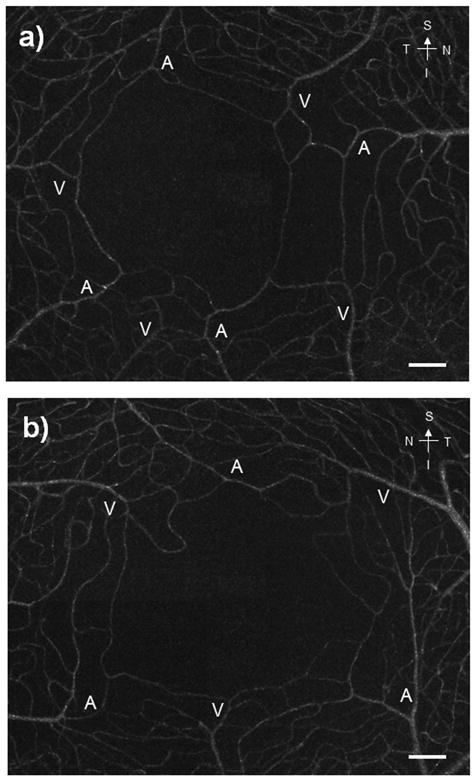
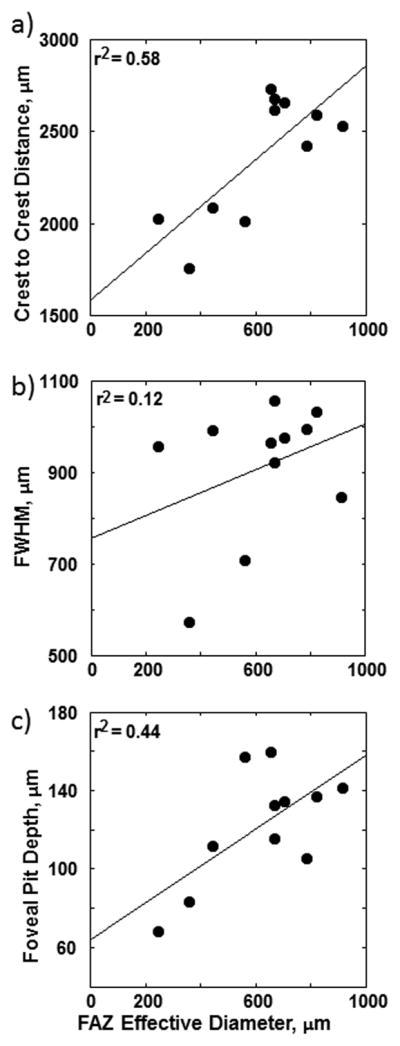
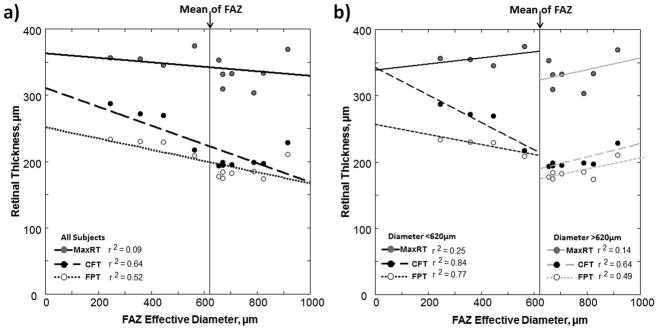
Results: A well-demarcated FAZ was seen in 11 subjects tested with foveal capillary imaging. There was considerable individual variation in the size and shape of the FAZ. The mean FAZ area and mean FAZ effective diameter were 0.33 mm(2) and 622 μm, respectively. Foveal thickness was found to be negatively correlated with the FAZ effective diameter.

Conclusions: The structure of the capillary network could be evaluated in the fovea and parafovea using our approach. We find that a smaller FAZ is associated with a narrower foveal pit opening and a thicker fovea.


Figures

Figure 1
Figure 1
Registered video sequences of retinal vasculature. Videos were obtained at (a) 1° superior retina (Video 1 available at [LWW insert link]) and (c) 3° inferior retina (Video 2 available at [LWW insert link]). The variance maps of the corresponding images are shown in (b) and (d). In general each capillary can be found in the processed images on the right column. Scale bar = 50 μm.
Figure 2
Figure 2
Videos with 16 registered frames obtained at 1° temporal retina showing (a) cone photoreceptor using a 200μm confocal aperture and (b) retinal capillary using a 500μm confocal aperture. Arrow indicates individual RBCs flowing inside a capillary. Scale bar = 50μm. (Video 3 available at [LWW insert link]).
Figure 3
Figure 3
Parameters obtained from the horizontal and vertical foveal SDOCT scans. ILM – Border of the inner limiting membrane (white solid line); ONL/OPL – Border of the outer nuclear layer and the outer plexiform layer (white dashed line); RPE – Anterior boundary of the retinal pigment epithelium (black dashed line). Segmentation lines on the left side have been removed for better visualization of the image. MaxRT – Maximum retinal thickness; CFT – Central foveal thickness; FPT – Foveal photoreceptor thickness.
Figure 4
Figure 4
A montage of images from the vascular mapping technique. In this image the regions of high variance are shown as dark to improve visibility of the vascular tree. Scale bars = 200 μm.
Figure 5
Figure 5
foveal vasculature maps in both eyes from the same subject. Arterioles and venules are labeled as “A” and “V”, respectively. In these montages, capillaries connecting the arterioles and the venules are clearly seen. Scale bars = 100 μm.
Figure 6
Figure 6
(a & b) Foveal capillary montages collected from a 57-year-old male, who has capillaries running close to the foveola. Asterisks indicate the projection of the subject’s fixation point on the retina. (c–f) Horizontal and vertical foveal b-scans of the corresponding foveal capillary montages on a & b. SDOCT scans reveal an overall thickening of the retina at the foveola as indicated by the white arrows.
Figure 7
Figure 7
(a) Mean crest to crest (CC) distance, (b) mean full width half maximum (FWHM), and c) mean foveal depth (FD) obtained from the horizontal and vertical foveal b-scans as a function of FAZ effective diameter. Linear regressions to the data are showed by the solid lines. Only the regression slopes to the crest to crest distance and foveal pit depth are statistically significant with p<0.05.
Figure 8
Figure 8
Relationship between retinal layer thicknesses and FAZ effective diameter. The solid lines are the linear regression of the mean maximum retinal thickness (MaxRT) obtained from both horizontal and vertical foveal b-scans. The dashed lines are the linear regression of the mean central foveal thickness (CFT). The dotted lines are the linear regression of the mean foveal photoreceptor thickness (FPT). (a) Regression lines represent correlations for all subjects. (b) Regression lines represent correlations in subjects with FAZ diameter less than (black lines) or greater than (gray lines) the sample mean of 620 μm.

References

    1. Provis JM, Sandercoe T, Hendrickson AE. Astrocytes and blood vessels define the foveal rim during primate retinal development. Invest Ophthalmol Vis Sci. 2000;41:2827–36. - PubMed
    1. Springer AD, Hendrickson AE. Development of the primate area of high acuity. 1. Use of finite element analysis models to identify mechanical variables affecting pit formation. Vis Neurosci. 2004;21:53–62. - PubMed
    1. Springer AD, Hendrickson AE. Development of the primate area of high acuity. 2. Quantitative morphological changes associated with retinal and pars plana growth. Vis Neurosci. 2004;21:775–90. - PubMed
    1. Springer AD, Hendrickson AE. Development of the primate area of high acuity, 3: temporal relationships between pit formation, retinal elongation and cone packing. Vis Neurosci. 2005;22:171–85. - PubMed
    1. Bradley A, Zhang H, Applegate RA, Thibos LN, Elsner AE. Entoptic image quality of the retinal vasculature. Vision Res. 1998;38:2685–96. - PubMed

Publication types