. 2012 Apr;122(4):1209-21.
doi: 10.1172/JCI61134. Epub 2012 Mar 19.

Mouse and computational models link Mlc2v dephosphorylation to altered myosin kinetics in early cardiac disease

Affiliations

Mouse and computational models link Mlc2v dephosphorylation to altered myosin kinetics in early cardiac disease

Farah Sheikh et al. J Clin Invest. 2012 Apr.

Abstract

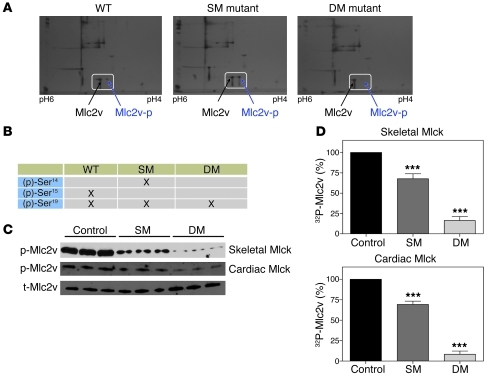
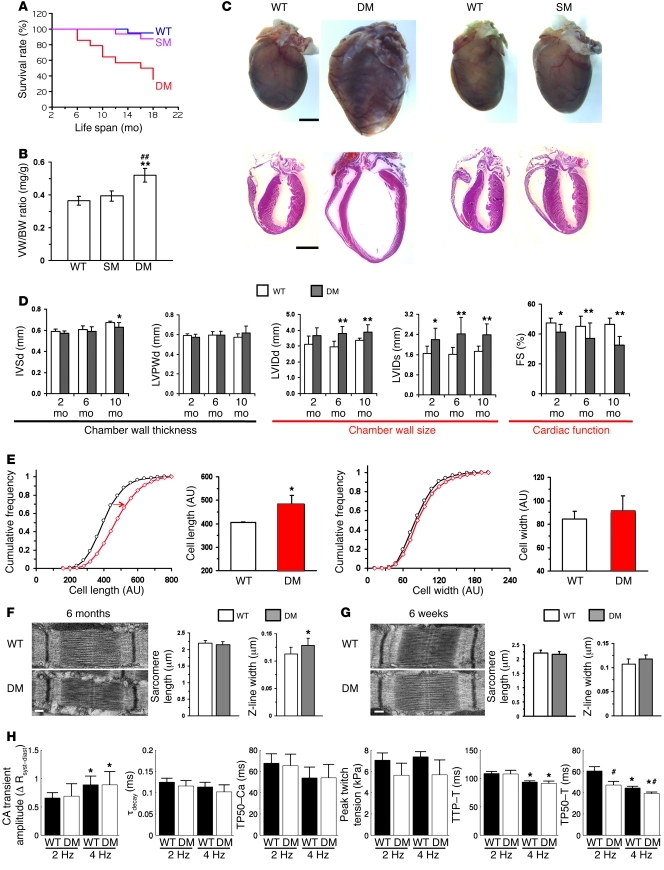
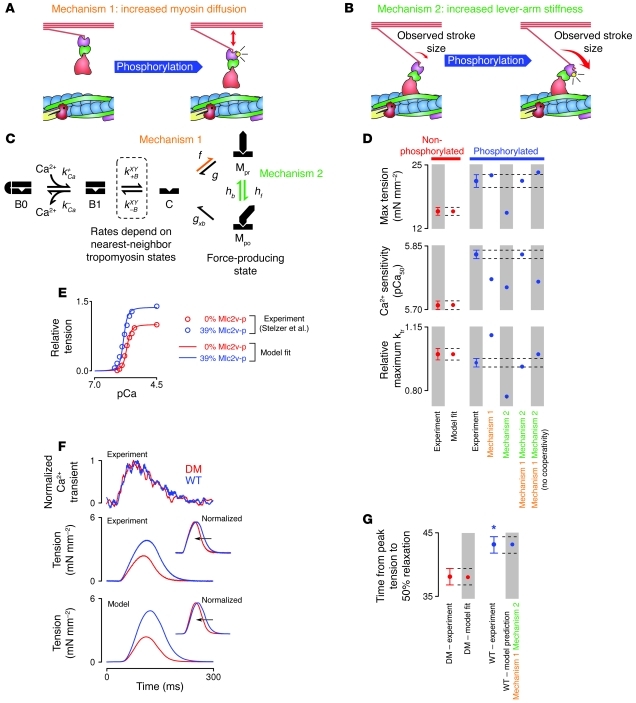
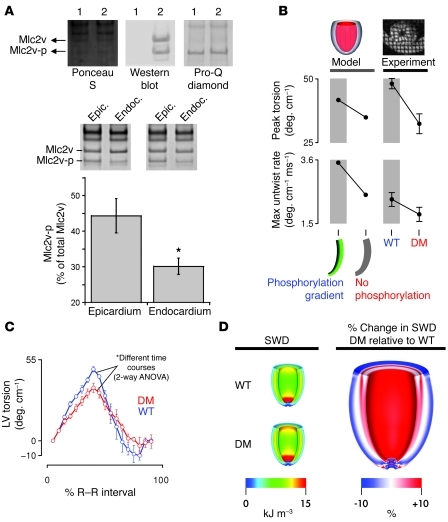
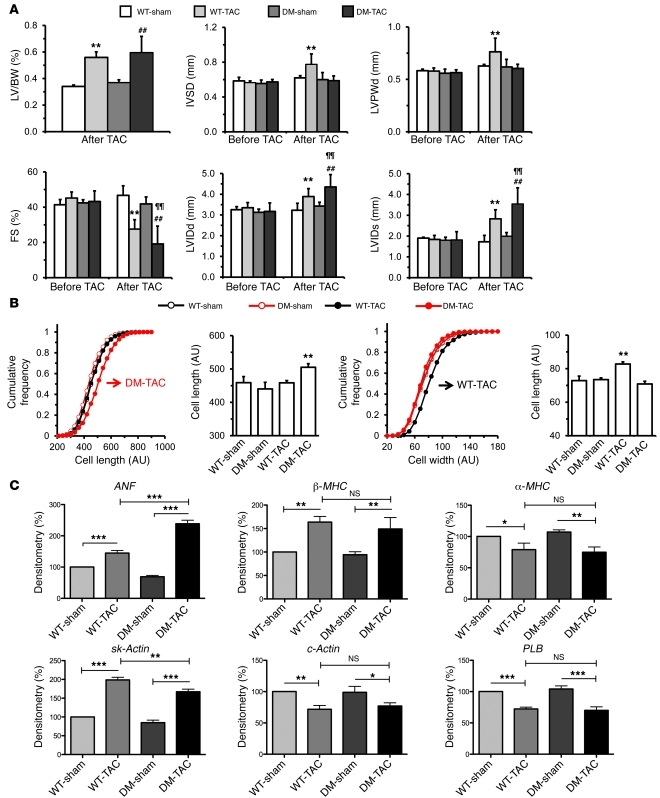
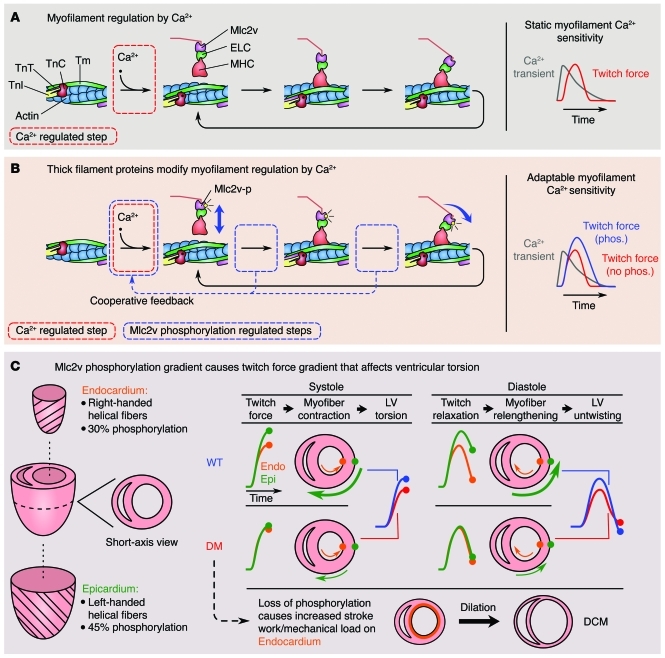
Actin-myosin interactions provide the driving force underlying each heartbeat. The current view is that actin-bound regulatory proteins play a dominant role in the activation of calcium-dependent cardiac muscle contraction. In contrast, the relevance and nature of regulation by myosin regulatory proteins (for example, myosin light chain-2 [MLC2]) in cardiac muscle remain poorly understood. By integrating gene-targeted mouse and computational models, we have identified an indispensable role for ventricular Mlc2 (Mlc2v) phosphorylation in regulating cardiac muscle contraction. Cardiac myosin cycling kinetics, which directly control actin-myosin interactions, were directly affected, but surprisingly, Mlc2v phosphorylation also fed back to cooperatively influence calcium-dependent activation of the thin filament. Loss of these mechanisms produced early defects in the rate of cardiac muscle twitch relaxation and ventricular torsion. Strikingly, these defects preceded the left ventricular dysfunction of heart disease and failure in a mouse model with nonphosphorylatable Mlc2v. Thus, there is a direct and early role for Mlc2 phosphorylation in regulating actin-myosin interactions in striated muscle contraction, and dephosphorylation of Mlc2 or loss of these mechanisms can play a critical role in heart failure.


Figures

Figure 1
Figure 1. Assessment of endogenous Mlc2v phosphorylation in Mlc2v mutant mouse lines in vivo.
(A) 2D gel analysis of Mlc2v in myofilament proteins in mice at 6 weeks of age. Silver-stained gels were used to determine percentage of Mlc2v phosphorylation (Mlc2v-p) by densitometry as shown in the representative gels. Unphosphorylated (left) and phosphorylated (p) (right) Moc2v are highlighted in gels. (B) Summary chart depicting the mass spectrometry analysis of endogenous Mlc2v Ser14, Ser15, and Ser19 phosphorylation in myofilament proteins in mice at 6 weeks of age. (C) Representative autoradiograms show levels of phosphorylated Mlc2v (Mlc2v-p) catalyzed by skeletal (top panel) and cardiac (middle panel) Mlck in mice (n = 3). Total Mlc2v (t-Mlc2v) is shown as a loading control. (D) Phosphorylated Mlc2v protein catalyzed by skeletal (top) and cardiac (bottom) Mlck was quantified through liquid scintillation counting in SM and DM mutant mice and expressed as a percentage of WT, which are set to 100%. Percentage values are expressed as mean ± SEM (n = 3). ***P < 0.001.
Figure 2
Figure 2. DM mice display premature death due to heart failure and early cardiac twitch relaxation defects.
(A) Kaplan-Meier survival analysis. (B) Ventricular weight to body weight ratios (VW/BW) in WT (n = 7), SM (n = 10), and DM (n = 5) mice. **P < 0.01 DM versus WT; ##P < 0.01 DM versus SM. (C) Whole mouse heart (top) and H&E-stained sections (bottom). Scale bars: 2 mm. (D) Echocardiographic measurements from WT (n = 6, 2 months; n = 10, 6 months; n = 10, 10 months) and DM (n = 6, 2 months; n = 9, 6 months; n = 8, 10 months) mice. IVSd: interventricular septal wall thickness at end diastole; LVPWd: LV posterior wall thickness at end diastole; LVIDd/LVIDs: LV internal dimension at end diastole and at end systole; FS (%), LV fractional shortening. *P < 0.05; **P < 0.01. (E) Cardiomyocyte dimensions in WT (black line, n = 3) and DM (red line, n = 3) mice at 6 months. Arrow shows shift in cell length. *P < 0.05. (F and G) Electron micrographs from mouse LV at (F) 6 months and (G) 6 weeks. Sarcomere length and Z-line widths (n = >100 per heart, n = 3). Scale bars: 200 nm. *P < 0.05. (H) WT (n = 9) and DM (n = 7) Ca2+ and twitch transients. ΔRsyst–diast, change in Fura-2 fluorescence ratio; τdecay, Ca2+ transient decay time constant; TP50-Ca (–T), time from peak to 50% (tension transient) decay; TTP-T, time from stimulus to peak tension. *P < 0.05 versus same group at 2 Hz; #P < 0.05 versus WT at same pacing frequency. Data are expressed as mean values ± SEM.
Figure 3
Figure 3. A computational model identifies dual molecular roles for ventricular Mlc2 phosphorylation (Mlc2v-p) in regulating cardiac actin-myosin interactions that underlie twitch relaxation defects in DM mice.
The effects of Mlc2v-p on (A) myosin head diffusion (17) and (B) myosin lever arm stiffness (18, 20) were tested. (C) A recent model of myofilament function (21) was modified to include Mlc2v-p mechanisms (orange, mechanism 1; green, mechanism 2). Refer to Supplemental Methods and Supplemental Tables 1 and 2 for details. (D) Model parameters for 0% Mlc2v-p were adjusted such that model fit matched maximum tension, Ca2+ sensitivity to force (pCa50), and relative maximum rate of force redevelopment (ktr) in dephosphorylated skinned mouse myocardium (28, 29). Model fit to experimental data in phosphorylated skinned myocardium (28, 29) was obtained with both mechanisms. (E) Model fits (lines) to experimental data from steady-state force-pCa curves measured in dephosphorylated (red circle) and phosphorylated (blue circle) skinned myocardium (digitized from Stelzer et al., ref. 29) were only obtained with both mechanisms. (F) Ca2+ transient and muscle twitch tension measurements in 6-week-old papillary muscles at 25°C. Muscle simulations used parameters of 0% (red trace) and 31% MLC2v-p (blue trace, value measured in WT myocardium in Figure 1A). Maximum tension and twitch relaxation defects in DM muscle were recapitulated by model simulations. Arrow denotes leftward shift (acceleration) when normalized to tension. Values for fit are in Supplemental Tables 1 and 2. (G) Model fit of TP50-T in WT and DM muscle using both mechanisms is shown.
Figure 4
Figure 4. Mlc2v phosphorylation–mediated mechanisms underlie the prefailure defects in ventricular torsion and subendocardial workload in DM mutant hearts in vivo.
(A) LV proteins were separated by urea-glycerol-PAGE, transferred to PVDF, and stained with Ponceau S (top, left panel) and blotted with no primary antibody control (lane 1) or Mlc2v antibodies (lane 2) (top, middle panel). A separate gel was stained with phospho-specific Pro-Q Diamond stain (top, right panel). Combined methods identified Mlc2v and Mlc2v-p bands. Middle panel: urea-glycerol-PAGE analysis of Mlc2v and Mlc2v-p in LV epicardial and endocardial samples from mice. Bottom panel: integrated optical density method was used to determine Mlc2v-p level in the LV epicardium and endocardium as a percentage of Mlc2v. Data are expressed as mean ± SEM (n = 4). *P < 0.05. (B) Finite element model of LV function was driven by Mlc2v phosphorylation–dependent mechanisms to test the effects of 0% (no phosphorylation gradient) and 15% (phosphorylation gradient) transmural gradients on simulated ventricular torsion over the cardiac cycle, as expressed as peak torsion (systole) and maximum untwist rate (diastole). (C) Ventricular torsion analysis in WT (blue trace) and DM (red trace) hearts is shown using tagged MRI. Values are expressed as mean ± SEM (n = 3). (D) 2D spatial simulations of mechanical work done by muscle fibers across the LV wall during the cardiac cycle (cardiac SWD) in WT and DM mutant hearts. Percentage change in SWD in DM relative to WT hearts is shown. Parameters used in multiscale finite element models are given in Supplemental Tables 1–5.
Figure 5
Figure 5. DM mutant mice are sensitized to pressure overload following TAC.
(A) LV to BW ratios as well as in vivo echocardiographic assessment of cardiac size and function in 6-week-old WT and DM mutant mice, before (pre) and following (post) sham and TAC operation for 1 week. **P < 0.01 versus WT-sham; ##P < 0.01 versus DM-sham, ¶¶P < 0.01 versus WT-TAC. Transstenotic pressure gradients within WT (82.35 ± 10.8 mmHg; n = 7) and DM (78.05 ± 9.7 mmHg; n = 7) hearts were not significantly different. No significant changes in heart rates were observed between mice between groups. (B) Cardiomyocyte length and widths are plotted from WT (black line; n = 3) versus DM (red line; n = 3) mice before and after sham and TAC operation for 1 week. Red arrow highlights shift toward higher cardiomyocyte length in DM-TAC. Data are expressed as AU. Left shift representative of increased cell width was only observed in cardiomyocytes isolated from WT-TAC. **P < 0.01 (C) ANF, β-MHC, α-MHC, sk-Actin, c-Actin, and PLB RNA expression in LV from mice before and after sham and TAC operation for 1 week (n = 3 in each group) are normalized to Gapdh RNA expression and expressed as a percentage (%) of WT-sham controls, which are set to 100%. *P < 0.05; **P < 0.01; ***P < 0.001. Data are expressed as mean values ± SEM.
Figure 6
Figure 6. Schematic model linking Mlc2v phosphorylation to twitch dynamics, ventricular mechanics, and early cardiac disease events.
(A) The traditional view of myofilament regulation is that binding of Ca2+ to troponin C (TnC) induces shifting of tropomyosin (Tm) to expose myosin binding sites on the actin filament. This implies a static relationship between the Ca2+ transient and twitch tension, with Ca2+ signaling as the primary determinant of twitch dynamics. (B) Our new evidence shows that posttranslational modification of thick filament proteins (e.g., Mlc2v phosphorylation) alters Ca2+ sensitivity of the filaments, highlighting a previously unappreciated adaptable relationship. Mlc2v phosphorylation simultaneously increases myosin binding and myosin lever arm stiffness, altering kinetics of crossbridge cycling (shown by dashed blue boxes) to increase crossbridge duty ratio. This phosphorylation-dependent behavior of myosin can positively cooperative to influence calcium-dependent activation and kinetics of the thin filament by allowing crossbridges to cooperatively activate neighboring binding sites on actin (dashed blue arrow). (C) Mlc2v phosphorylation can regulate ventricular torsion because Mlc2v phosphorylation levels vary through the LV wall. Higher phosphorylation in the left-handed helical fibers of WT epicardium enhances their twitch tension and consequently peak torsion compared with DM mice. Because elevated Mlc2v phosphorylation also lengthens twitch duration, diastolic untwisting in WT mice is dominated by epicardial fibers. Without opposition by right-handed endocardial fibers, the untwisting rate is increased relative to DM. Meeting hemodynamic demand without the benefit of epicardial Mlc2v hyperphosphorylation elevates endocardial workload in DM mice, contributing to DCM and heart failure (bottom).

References

    1. Spudich JA. The myosin swinging cross-bridge model. Nat Rev Mol Cell Biol. 2001;2(5):387–392. doi: 10.1038/35073086. - DOI - PubMed
    1. Morita H, Seidman J, Seidman CE. Genetic causes of human heart failure. J Clin Invest. 2005;115(3):518–526. - PMC - PubMed
    1. Ebashi S, Endo M. Calcium ion and muscle contraction. Prog Biophys Mol Biol. 1968;18:123–183. doi: 10.1016/0079-6107(68)90023-0. - DOI - PubMed
    1. Gordon AM, Homsher E, Regnier M. Regulation of contraction in striated muscle. Physiol Rev. 2000;80(2):853–924. - PubMed
    1. Sweeney HL, Bowman BF, Stull JT. Myosin light chain phosphorylation in vertebrate striated muscle: regulation and function. Am J Physiol. 1993;264(5 pt 1):C1085–C1095. - PubMed

Publication types

MeSH terms