. 2012 Feb 28:3:702.
doi: 10.1038/ncomms1705.

Network physiology reveals relations between network topology and physiological function

Affiliations

Network physiology reveals relations between network topology and physiological function

Amir Bashan et al. Nat Commun. .

Abstract

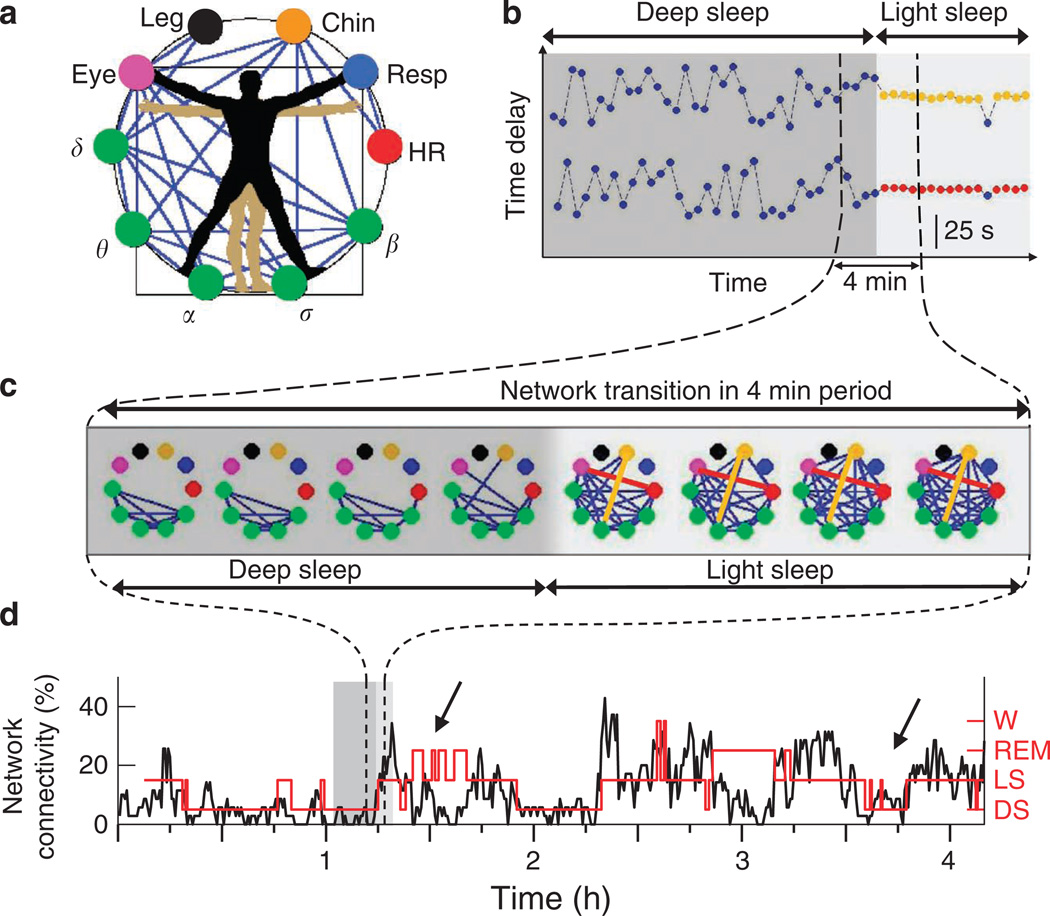
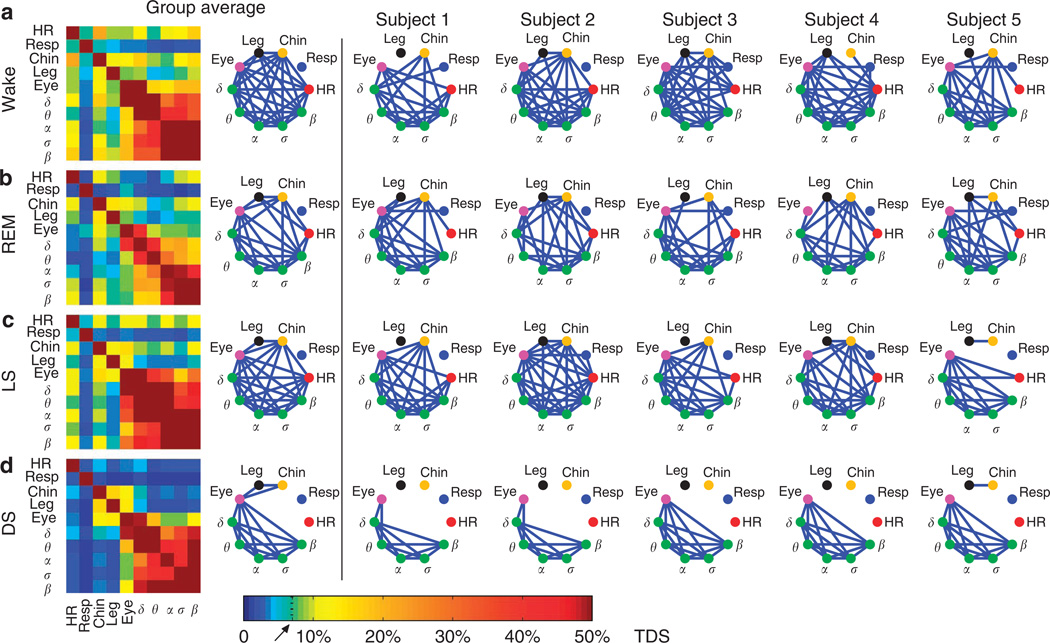
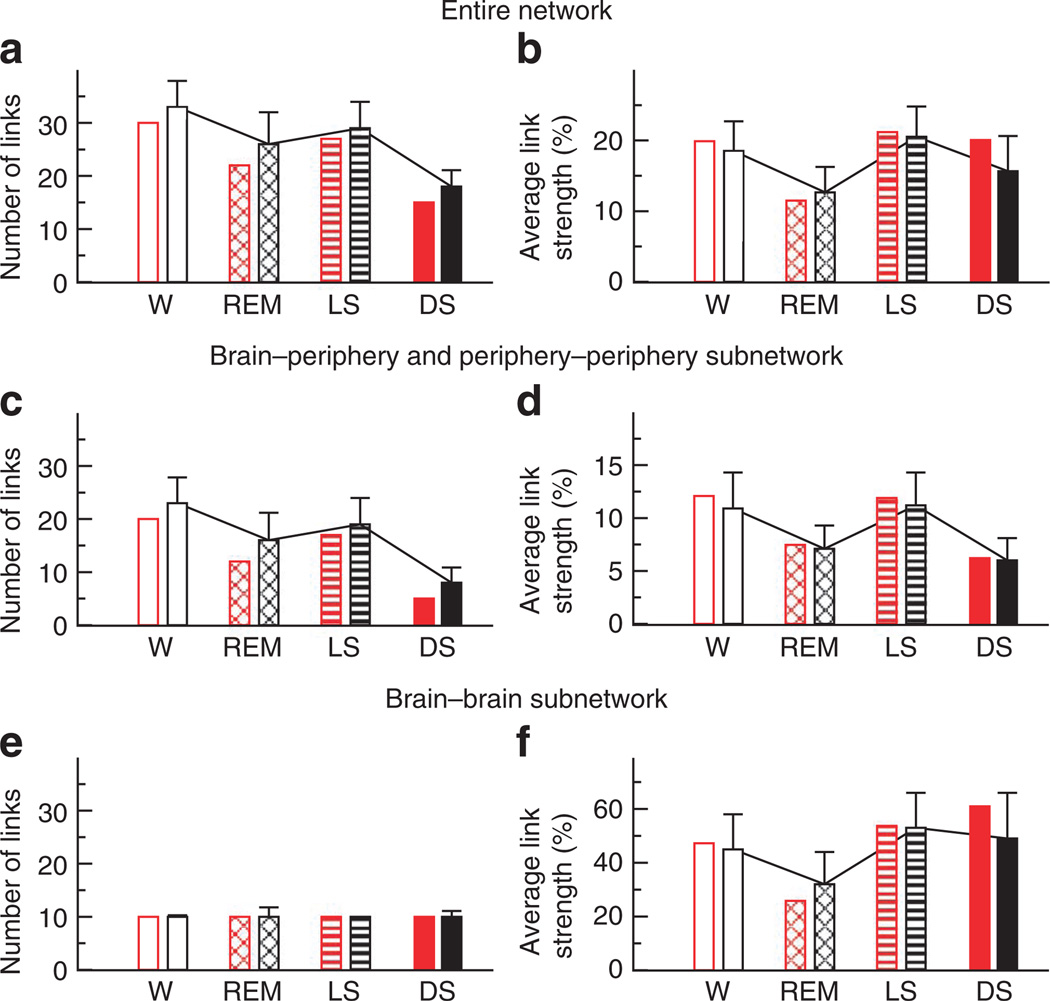
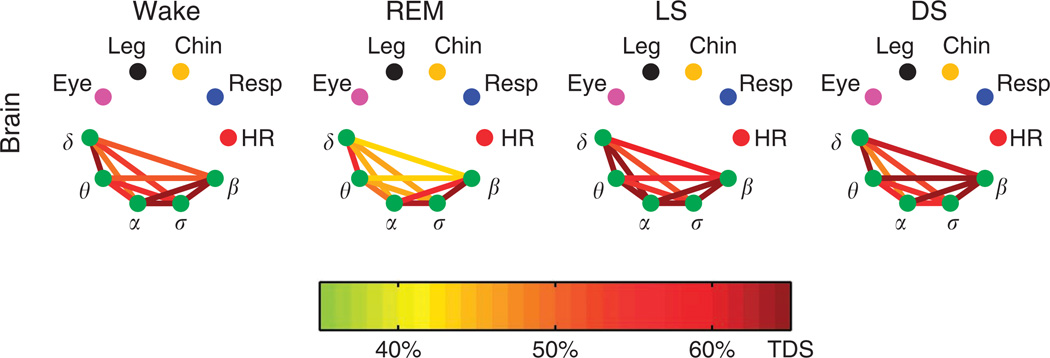
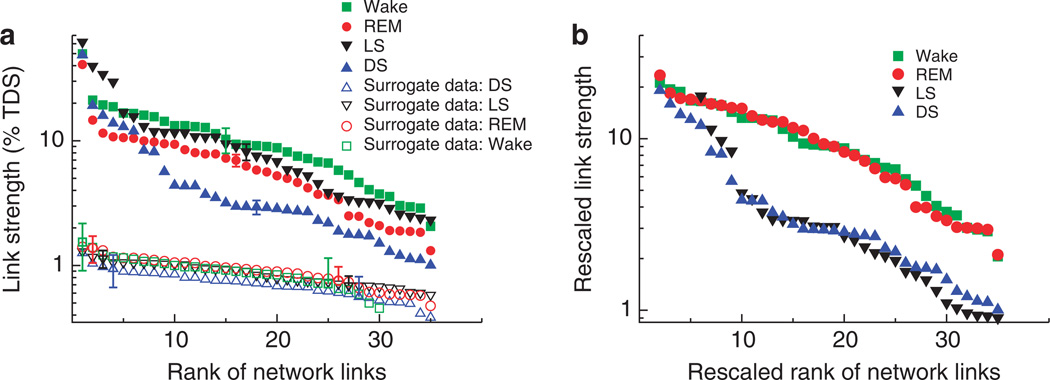
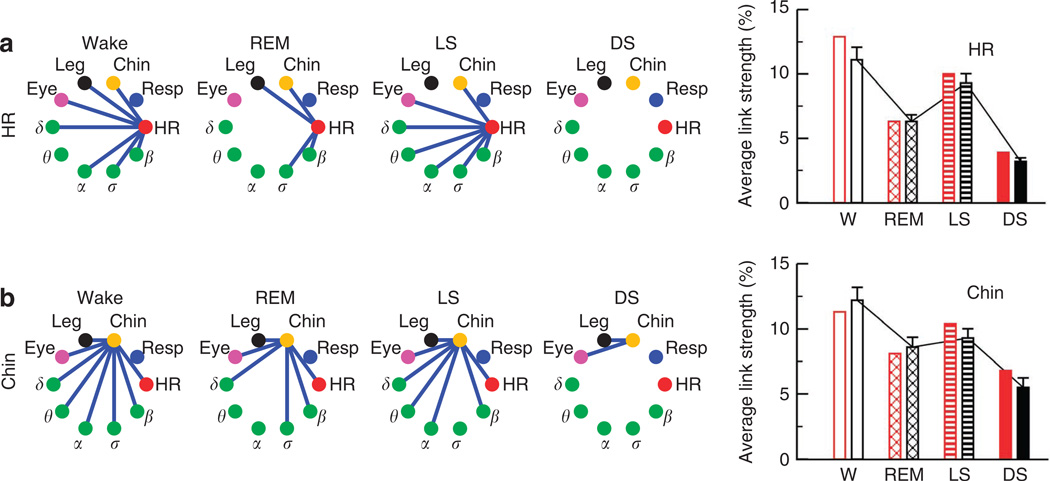
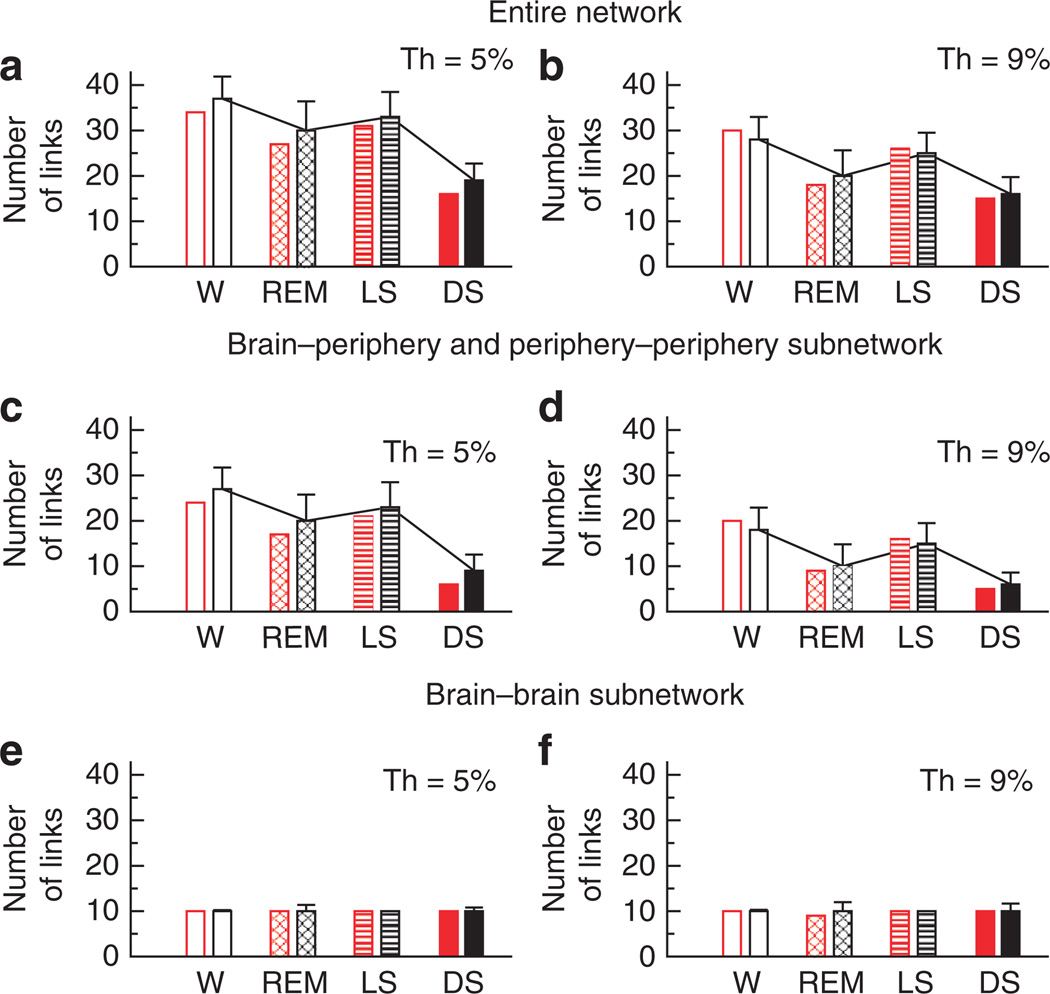
The human organism is an integrated network where complex physiological systems, each with its own regulatory mechanisms, continuously interact, and where failure of one system can trigger a breakdown of the entire network. Identifying and quantifying dynamical networks of diverse systems with different types of interactions is a challenge. Here we develop a framework to probe interactions among diverse systems, and we identify a physiological network. We find that each physiological state is characterized by a specific network structure, demonstrating a robust interplay between network topology and function. Across physiological states, the network undergoes topological transitions associated with fast reorganization of physiological interactions on time scales of a few minutes, indicating high network flexibility in response to perturbations. The proposed system-wide integrative approach may facilitate the development of a new field, Network Physiology.


Figures

Figure 1
Figure 1. Transitions in the network of physiological interactions
(a) Dynamical network of interactions between physiological systems where ten network nodes represent six physiological systems—brain activity (EEG waves: δ, θ, α, σ and β), cardiac (HR), respiratory (Resp), chin muscle tone, leg and eye movements. (b) Transition in the interactions between physiological systems across sleep stages. The time delay between two pairs of signals, (top) α-brain waves and chin muscle tone, and (bottom) HR and eye movement, quantifies their physiological interaction: highly irregular behaviour (blue dots) during deep sleep is followed by a period of TDS during light sleep indicating a stable physiological interaction (red dots for the HR–eye and orange dots for the α–chin interaction). (c) Transitions between physiological states are associated with changes in network topology: snapshots over 30-s windows during a transition from deep sleep (dark grey) to light sleep (light grey). During deep sleep, the network consists mainly of brain–brain links. With transition to light sleep, links between other physiological systems (network nodes) emerge and the network becomes highly connected. The stable α–chin and HR–eye interactions during light sleep in (b) are shown by an orange and a red network link, respectively. (d) Physiological network connectivity for one subject during night sleep calculated in 30-s windows as the fraction (%) of present links out of all possible links (brain–brain links not included, see Fig. 3e). Red line marks sleep stages as scored in a sleep lab. Low connectivity is consistently observed during deep sleep (0:30–1:15 h and 1:50–2:20 h) and REM sleep (1:30–1:45 h and 2:50–3:10 h), while transitions to light sleep and wake are associated with a significant increase in connectivity.
Figure 2
Figure 2. Network connectivity across sleep stages
Group-averaged time delay stability (TDS) matrices and related networks of physiological interactions during different sleep stages: (a) wake; (b) REM sleep; (c) light sleep (LS); (d) deep sleep (DS). Matrix elements are obtained by quantifying the TDS for each pair of physiological systems after obtaining the weighted average of all subjects in the group: % TDs=(∑i si/∑iLi) × 100 where Li indicates the total duration of a given sleep stage for subject i, and si is the total duration of TDS within Li for the considered pair of physiological signals. Colour code represents the average strength of interaction between systems quantified as the fraction of time (out of the total duration of a given sleep stage throughout the night) when TDS is observed. A network link between two systems is defined when their interaction is characterized by a TDS of ≥7% (arrow), a threshold determined by surrogate analysis (see Methods). The physiological network exhibits transitions across sleep stages—lowest number of links during deep sleep (d), higher during REM (b), and highest during light sleep (c) and quiet wake (a)—a behaviour observed in the group-averaged network as well as for each subject. Network topology also changes with sleep-stage transitions: from predominantly brain–brain links during deep sleep to a high number of brain–periphery and periphery–periphery links during light sleep and wake.
Figure 3
Figure 3. Sleep-stage stratification pattern in network connectivity and network link strength
Group-averaged number of links (a) and averaged link strength (b) are significantly higher during wake and light sleep compared with REM and deep sleep (Student t-test P<10−3 for both quantities when comparing REM and deep sleep with wake and light sleep). There is no significant difference between wake and light sleep (P>5×10⁻²). This pattern is even more pronounced for the subnetwork formed by the brain–periphery and periphery–periphery links shown in (c) and (d) (P<10−6 for both quantities when comparing REM and deep sleep with wake and light sleep). In contrast, the number of brain–brain links remains practically unchanged with sleep-stage transitions (e), and the average brain–brain link is ≈5 times stronger in all sleep stages compared with the other network links (f). The group-averaged patterns in the number of network links and in the average link strength across sleep stages (black bars) are consistent with the behaviour observed for individual subjects (red bars in all panels represent the same subject). The group-averaged number of links for each sleep stage is obtained from the corresponding group-averaged network in Fig. 2. The average link strength is measured in % TDS and is obtained by taking the mean of all elements in the TDS matrix for each sleep stage (Fig. 2); it represents the average strength of all links in a network obtained from a given subject during a specific sleep stage, which then is averaged over all subjects. Error bars indicate s.d. obtained from a group of 36 subjects (Methods).
Figure 4
Figure 4. Network connectivity and link strength of the brain–brain subnetwork for different sleep stages
While the topology of the brain subnetwork does not change, the strength of network links significantly changes with strongest links during light sleep and deep sleep (brown and dark red colour), intermediate during wake (red and orange colour) and weakest links during REM sleep (yellow colour).
Figure 5
Figure 5. Rank distributions of the strength of network links
Group-averaged strength of individual physiological network links for different sleep stages. Rank 1 corresponds to the strongest link in the network, that is, highest degree of time delay stability (TDS) (shown are all periphery–periphery and brain–periphery links). (a) The rank distributions for different sleep stages are characterized by different strength of the network links measured in % TDS—consistently lower values for most links during deep sleep, higher values during REM and highest during light sleep and wake, indicating that the stratification pattern in Fig. 3d is present not only for the average link strength (when averaging over different types of links in the network) but also for the strength of individual links. Indeed, links from all ranks are consistently stronger in light sleep compared with deep sleep and REM: such rank-by-rank comparison of links across sleep stages is possible because the rank order of the links does not change significantly from one sleep stage to another (Wilcoxon signed-rank test for all pairs of rank distributions yields 0.77≤P≤0.93). A surrogate test based on TDS analysis of signals paired from different subjects, which eliminates endogenous physiological coupling, leads to significantly reduced link strength (P<10−3) and close to uniform rank distributions with no difference between sleep stages (open symbols), indicating that the TDS method uncovers physiologically relevant information. Error bars for the original and surrogate data indicate the standard error for a specific link when averaged over all 36 subjects or over 36 surrogate pairs respectively. (b) Rescaling the plots reveals two distinct forms of rank distributions: a slow decaying distribution for wake and REM, and a fast decaying distribution for light sleep and deep sleep with a pronounced plateau in the middle rank range corresponding to a cluster of links with similar strength, most of which are related to the cardiac system.
Figure 6
Figure 6. Transitions in connectivity and link strength of individual network nodes across sleep stages
The number of links to specific network nodes significantly changes, with practically no links during deep sleep, a few links during REM and much higher connectivity during light sleep and wake. Notably, the average strength of the links connecting a given network node is also lowest during deep sleep and highest during light sleep and wake. Shown are connectivity and average link strength for two network nodes: (a) heart and (b) chin. This sleep-stage stratification pattern in individual node connectivity and in the average strength of the links connecting a specific network node is consistent with the transitions of the entire network across sleep stages shown in Fig. 3 c,d. Networks for (a) heart and (b) chin are obtained by averaging the corresponding networks for all subjects. During deep sleep, no links to the heart are shown as the strength of each link averaged over all subjects is below the significance threshold (Figs 2 and 7, Methods). Right bars in the panels represent for different sleep stages the group mean of the average strength of network links connecting the heart and chin, respectively, and error bars show the s.d. obtained from a group of 36 subjects (Methods). Left bars represent an individual subject. Note that the absence of a link between heart rate and respiration in the physiological network does not indicate absence of cardio–respiratory coupling but rather that this coupling as represented by time delay stability (TDS) is rarely stable for periods longer than 2–4 min (where 2 min is the minimum window over which TDS is determined; Method section), and that cardio–respiratory TDS episodes form <7% of the recordings, which is the significance threshold level (Method section). Such ‘on’ and ‘off’ intermittent interaction between these two systems is observed also in other independent measures of cardio–respiratory coupling—respiratory sinus arrhythmia (RSA), and the degree of phase synchronization—where relatively short ‘on’ episodes are separated by periods of no interrelation as quantified by these measures.
Figure 7
Figure 7. Determining significance threshold for the strength of network links
With increasing the time delay stability (TDS) threshold level that allows only stronger links with higher TDS values to be considered in the physiological network, the fraction of statistically significant network links that carry physiologically relevant information also increases, and at a significance threshold of ≈7% TDS (marked by a vertical dashed line) all network links (100%) are statistically significant. Periphery–periphery and brain–periphery links during all sleep stages are considered when determining this threshold. Statistical significance of a specific physiological link is estimated by comparing the strength distribution of this link across all subjects in the group with a distribution of surrogate links representing ‘interactions’ between the same systems paired from different subjects. Based on this surrogate test, a P-value <10−3 obtained from the Student t-test indicates statistically significant strength of a given link.
Figure 8
Figure 8. Cross-correlation and surrogate analysis
Rank plots obtained from cross-correlation analysis show no statistically significant differences between real and surrogate data, indicating that cross-correlation is not a reliable measure to identify physiological interactions.
Figure 9
Figure 9. Stability of sleep-stage stratification pattern in network connectivity
Group-averaged number of network links for two different thresholds (Th) during wake, REM, light and deep sleep. Results for threshold of Th = 5% time delay stability (TDS) are shown in a, c and e, and results for threshold of Th = 9% TDS are shown in b, d and f. The sleep-stage stratification pattern observed for the significance threshold of 7% TDS (shown in Fig. 3) is preserved also for thresholds of 5 and 9% TDS, indicating stability of the results. Note that the number of links in the brain–brain subnetwork remains unchanged for different sleep stages (e, f) as the strength of all links in this subnetwork is well above 9% TDS (Fig. 3f).

References

    1. Bassingthwaighte JB, Liebovitch L, West BJ. Fractal Physiology. Oxford University Press; 1994.
    1. West GB, Brown JH, Enquist BJ. A general model for the origin of allometric scaling laws in biology. Science. 1997;276:122–126. - PubMed
    1. Bunde A, et al. Correlated and uncorrelated regions in heart-rate fluctuations during sleep. Phys. Rev. Lett. 2000;85:3736–3739. - PubMed
    1. Dvir I, Adler Y, Freimark D, Lavie P. Evidence for fractal correlation properties in variations of peripheral arterial tone during REM sleep. Am. J. Physiol. Heart Circ. Physiol. 2002;283:H434–H439. - PubMed
    1. Ivanov PCh, et al. Scaling behaviour of heartbeat intervals obtained by wavelet-based time-series analysis. Nature. 1996;383:323–327. - PubMed

Publication types