. 2012 Feb 28:3:708.
doi: 10.1038/ncomms1708.

Telomeres are favoured targets of a persistent DNA damage response in ageing and stress-induced senescence

Affiliations

Telomeres are favoured targets of a persistent DNA damage response in ageing and stress-induced senescence

Graeme Hewitt et al. Nat Commun. .

Abstract

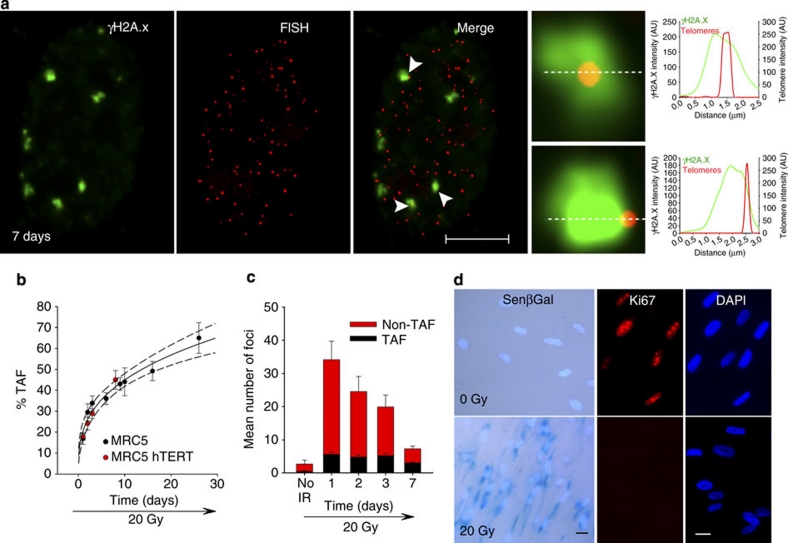
Telomeres are specialized nucleoprotein structures, which protect chromosome ends and have been implicated in the ageing process. Telomere shortening has been shown to contribute to a persistent DNA damage response (DDR) during replicative senescence, the irreversible loss of division potential of somatic cells. Similarly, persistent DDR foci can be found in stress-induced senescence, although their nature is not understood. Here we show, using immuno-fluorescent in situ hybridization and ChIP, that up to half of the DNA damage foci in stress-induced senescence are located at telomeres irrespective of telomerase activity. Moreover, live-cell imaging experiments reveal that all persistent foci are associated with telomeres. Finally, we report an age-dependent increase in frequencies of telomere-associated foci in gut and liver of mice, occurring irrespectively of telomere length. We conclude that telomeres are important targets for stress in vitro and in vivo and this has important consequences for the ageing process.


Figures

Figure 1
Figure 1. TAF are persistent following X-ray-induced senescence in MRC5 fibroblasts with or without telomerase activity.
(a) Total number of γH2A.X foci in human fibroblasts 1 day following irradiation with 1, 5, 10 and 20 Gy. Data are mean±s.e.m. of n=15. (b) Total number of γH2A.X foci colocalizing with telomeres (TAF) in MRC5 fibroblasts 1 day after irradiation with 1, 5, 10 and 20 Gy. Data are mean±s.e.m. of n=15. (c) Representative images of γH2A.X immuno-FISH in MRC5 fibroblasts 2, 6 and 16 days after 20 Gy. Images are Huygens (SVI) deconvolved Z projections of 3-μm stacks taken with a ×100 oil objective. White arrows indicate colocalization, and colocalizing foci are amplified in the right panel (amplified images are from single Z planes where colocalization was found). Scale bar=10 μm. (d) Percentage of γH2A.X foci colocalizing with telomeres (%TAF) in MRC5 fibroblasts up to 26 days after irradiation with 20 Gy. Data are mean±s.e.m. of n=15. (e) Mean number of both TAF and non-TAF in MRC5 fibroblasts up to 26 days after irradiation with 20 Gy. Data are mean±s.e.m. of n=15. (f) Enrichment of γH2AX at sub-telomeric regions was determined on chromosome 12p by ChIP followed by real-time PCR with previously independently validated primers at indicated distances from the chromosome end (10 days irradiated compared with non-irradiated MRC5 fibroblasts). Graph shows log2 ratios of irradiated and non-irradiated samples. Each PCR reaction was performed in triplicate. Data are mean from two independent ChIP experiments. (g) Enrichment of γH2AX at telomere repeats by real-time PCR. Graph represents fold enrichment of γH2AX at telomeric repeats between non-irradiated and 10 days irradiated cells for two independent ChIP experiments. Red line indicates non-irradiated control. (h) Graphs represent quantification of γH2A.X and telomere signals in selected regions of interest (dotted lines from 1c).
Figure 2
Figure 2. TAF are persistent following H2O2- and neocarzinostatin-induced senescence in MRC5 fibroblasts.
(a) Mean number of both TAF and non-TAF in MRC5 fibroblasts at 3 and 8 days after treatment for 1 h with hydrogen peroxide (400 μM in serum-free media). Data are mean±s.e.m., n=15. (b) Mean number of both TAF and non-TAF in MRC5 fibroblasts at 3 and 8 days after treatment for 1 h with neocarzinostatin (80 ng ml−1). Mean±s.e.m.; n=15. (c) Representative images of Sen-β-Gal staining in non-treated (NT) MRC5 fibroblasts and 10 days after 1 h treatment with NCS (80 ng ml−1) and H2O2 (400 μM) (light blue-DAPI; darker cytoplasmic blue- Sen-β-Gal). (d) Representative images of Ki67 staining in non-treated (NT) MRC5 fibroblasts and 10 days after 1 h treatment with NCS (80 ng ml−1) and H2O2 (400 μM). (e) Quantification of mean number of Sen-β-Gal-positive cells and (f) Ki67-positive nuclei. Data are mean±s.e.m. (n=3). Scale bar: 20 μm.
Figure 3
Figure 3. Overexpression of hTERT in MRC5 fibroblasts does not suppress irradiation-induced cellular senescence and persistence of TAF.
(a) Representative image of γH2A.X immuno-FISH in MRC5 fibroblasts overexpressing hTERT 7 days after 20 Gy. Images are Huygens (SVI) deconvolved Z projections of 3-μm stacks taken with a ×100 oil objective. White arrows indicate colocalization, and colocalizing foci are amplified in the right panel (amplified images are from single Z planes where colocalization was found). Graphs represent quantification of γH2A.X and telomere signals in selected regions of interest (dotted lines). Scale bar: 10 μm. (b) Comparison between % TAF in MRC5 fibroblasts with or without telomerase overexpression. Power curve (solid line) and 95% confidence intervals (dotted lines) are shown. Power curve best-fitted time-dependent increase in % TAF (R=0.9770, P=0.0001); Data are mean±s.e.m.; n=15. (c) Mean number of both TAF and non-TAF in MRC5 fibroblasts overexpressing hTERT up to 8 days after irradiation with 20 Gy; Mean±s.e.m.; n=15. (d) 20-Gy irradiation induces cellular senescence in MRC5 fibroblasts overexpressing hTERT. Representative images of staining for Sen-β-Gal (light blue: DAPI staining; cytoplasmic darker blue: Sen-β-Gal activity) and proliferation marker Ki67 (blue: DAPI, red: Ki67). Scale bar: 20 μm.
Figure 4
Figure 4. Telomere-associated foci can be visualized in live MEFs and are longer lived than non-telomeric foci.
(a) Percentage of 53BP1 foci colocalizing with telomeres (% TAF) in MEFs up to 10 days after irradiation with 10 Gy. (b) Mean number of both TAF and non-TAF in MEFs up to 10 days after irradiation with 20 Gy. (c) Representative images of Immuno-FISH using antibody against 53BP1 in fixed MEFs 1, 3 and 10 days after 10-Gy irradiation (red: telomeres, green: 53BP1). The white box indicates TAF and image on the right shows boxed image at higher magnification of a single Z plane. Images were taken with a Leica DM5500B fluorescence microscope. (d) Confocal time series of MEFs expressing AcGFP-53BP1c together with a PNA telomere probe 3 days after 10-Gy irradiation at the indicated times (min). Images are compressed stacks (maximum intensity projections) with a 4.5-μm focal depth. The white box indicates one TAF, which is permanent during the entire time series, and is shown at higher magnification on the right (single Z plane). White arrows indicate long-lived TAF and blue arrows short-lived non-TAF. (e) Kaplan–Mayer survival curves for AcGFP–53BP1c, which colocalize (TAF) or do not colocalize (non-TAF) with telomeres in MEFs 3 days after 10-Gy irradiation. The 200 foci were analysed from 8 cells. The Gehan–Breslow test shows a statistically significant difference between survival curves (P=<0.001). (f) Representative trace of AcGFP-53BP1c foci in one MEF for the indicated time 3 days after irradiation (10 Gy). Each bar represents the track of one individual focus recorded for the indicated time interval. 53BP1 foci colocalizing with telomere PNA probe are in red (TAF) and non-colocalizing foci are in black (non-TAF). A Zeiss LSM510 confocal microscope was used for live-cell imaging. Scale bars: 5 μm in d and 10 μm in c.
Figure 5
Figure 5. Telomere-associated foci increase with age in the liver and small intestine of C57BL/6 mice.
(a) Mean number of TAF per cell increases exponentially with age in hepatocytes from male C57BL/6 mice (exponential curve provided best fit with R=0.98; P=0.01) mean±s.e.m. of n=3 per age group. (b) Percentage of TAF increase linearly with age in hepatocytes from male C57BJ6 mice (R=0.92; P=0.02) mean±s.e.m. of n=3 per age group. (c) Representative immuno-FISH images of hepatocytes from 12-month- (left) and 42-month-old (right) mice. Green: γH2A.X; red: telomeres; blue: DAPI, Scale bar: 3 μm. (d) Mean number of TAF per cells increases exponentially with age in the small intestine enterocytes from male C57BL/6 mice (exponential curve provided best fit with R=0.95; P=0.02), mean±s.e.m. of n=3 per age group. (e) Percentage of TAF increases linearly with age in enterocytes from male C57BL/6 mice (R=0.98; P=0.007) mean±s.e.m. of n=3 per age group. (f) Representative immuno-FISH images in mice crypts at different ages. Boxed areas indicate colocalization between γH2A.X and telomeres, and are shown at higher magnification on the right (telomeres: red; γH2A.X: green and nucleus: DAPI; images are from one single Z plane), Scale bar: 20 μm. (g) Immuno-FISH images of 12-, 22-, 36- and 42-month-old mice colour coded according to degree of colocalization between γH2A.X and telomeres (white: low colocalization; red: high colocalization). (h) Histograms showing telomere intensity for telomeres colocalizing (bottom) or not colocalizing (top) with DNA damage foci in both the liver and gut from 36-month-old mice (n=3); red dotted line represents median intensity. Mann–Whitney test shows no significant difference in telomere intensities distribution between TAF and non-TAF for the small intestine (gut) (P=0.08) and a slight increase in liver telomere intensity in non-TAF (P=0.002). Intensity of 1,000 telomeres was analysed per condition. (i) Mean number of non-TAF per cell does not increase with age in small intestinal enterocytes from male C57BL/6 mice (linear curve provided best fit with R=0.77; P=0.12) mean±s.e.m. of n=3 per age group. (j) Mean number of non-TAF per cell does not increase with age in hepatocytes from male C57BL/6 mice (exponential curve provided best fit with R=0.86; P=0.07) mean±s.e.m. of n=3 per age group.

Comment in

References

    1. Campisi J. & d'Adda di Fagagna F. Cellular senescence: when bad things happen to good cells. Nat. Rev. Mol. Cell. Biol. 8, 729–740 (2007). - PubMed
    1. Herbig U., Ferreira M., Condel L., Carey D. & Sedivy J. M. Cellular senescence in aging primates. Science 311, 1257 (2006). - PubMed
    1. Wang C., Jurk D., Nelson G., Martin-Ruiz C. & von Zglinicki T. DNA damage response and cellular senescence in aging mice. Aging Cell 8, 311–323 (2009). - PubMed
    1. Price J. S. et al.. The role of chondrocyte senescence in osteoarthritis. Aging Cell 1, 57–65 (2002). - PubMed
    1. Chang E. & Harley C. B. Telomere length and replicative aging in human vascular tissues. Proc. Natl Acad. Sci. USA 92, 11190–11194 (1995). - PMC - PubMed

Publication types

MeSH terms