. 2012 Jun;463(6):799-818.
doi: 10.1007/s00424-012-1093-z. Epub 2012 Mar 17.

Interactions between the C-terminus of Kv1.5 and Kvβ regulate pyridine nucleotide-dependent changes in channel gating

Affiliations

Interactions between the C-terminus of Kv1.5 and Kvβ regulate pyridine nucleotide-dependent changes in channel gating

Srinivas M Tipparaju et al. Pflugers Arch. 2012 Jun.

Abstract

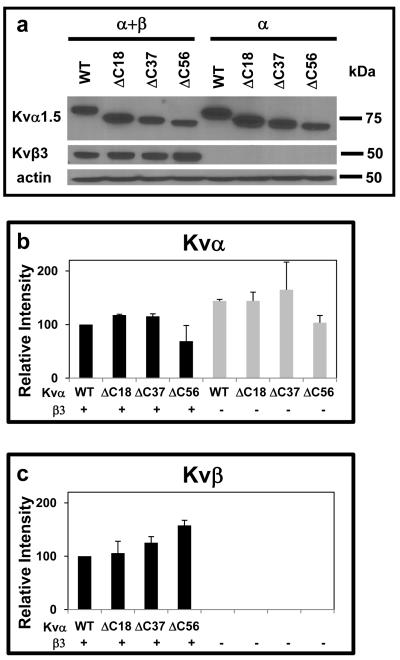
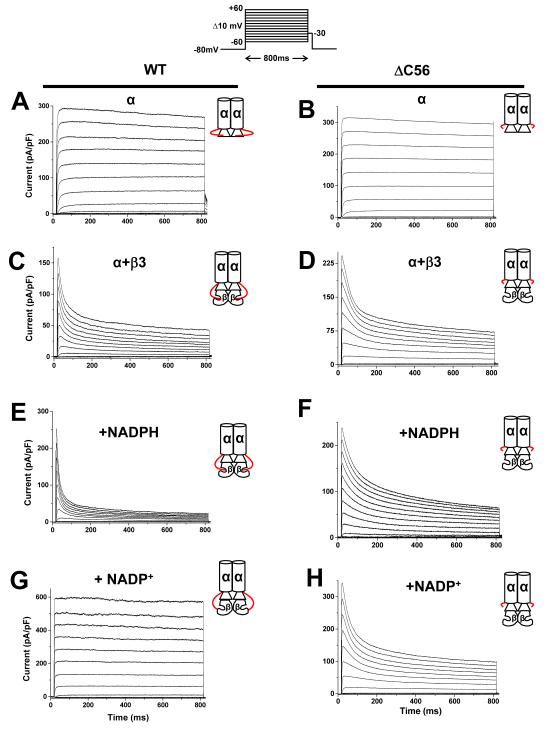
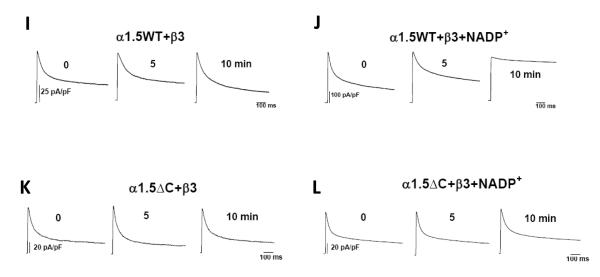
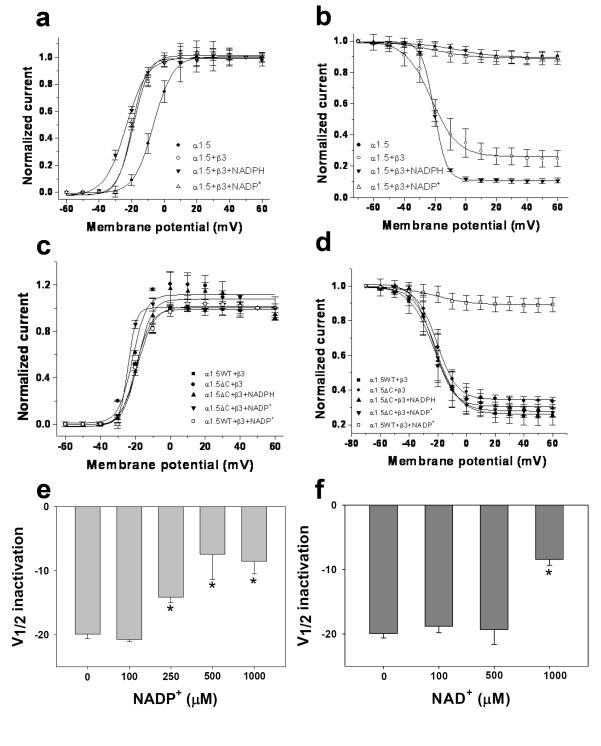
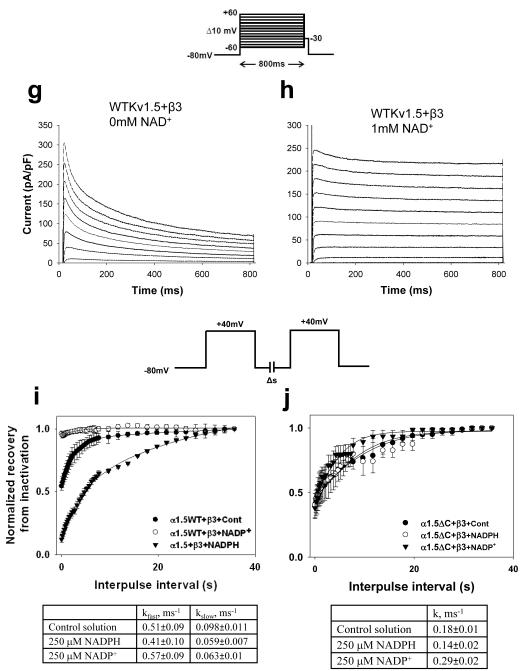
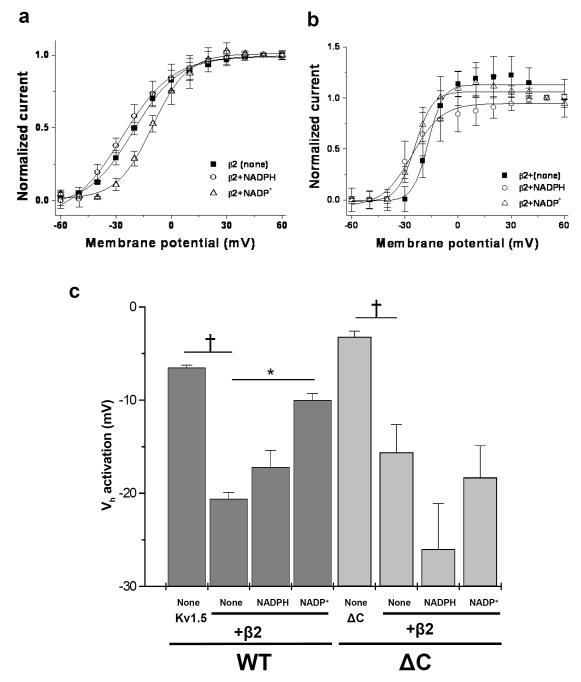
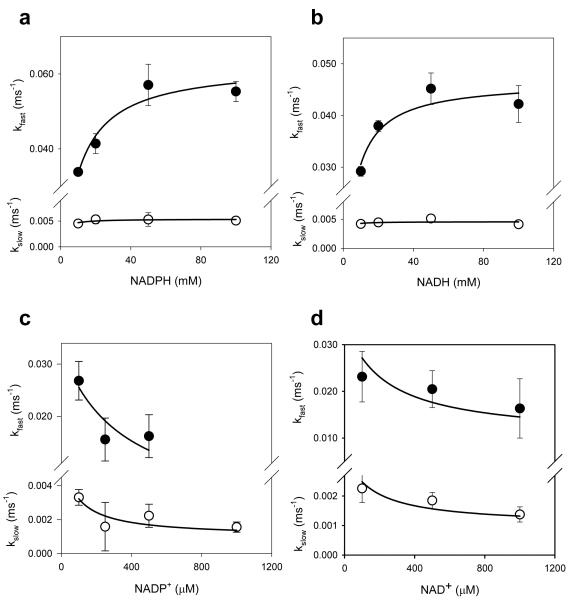
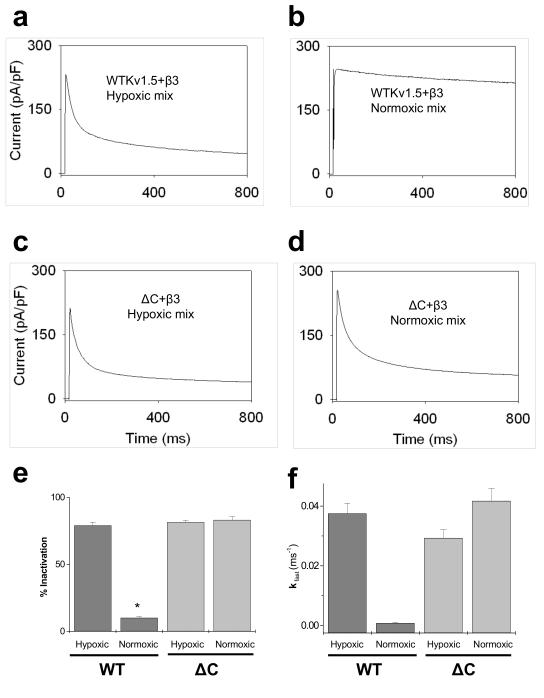
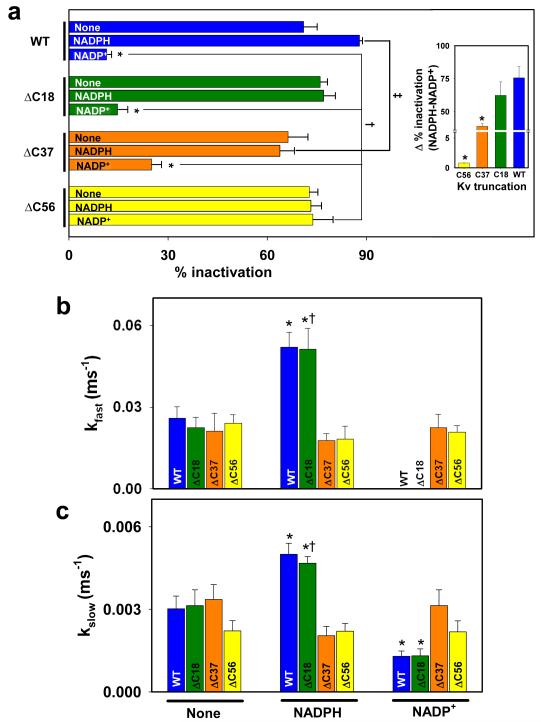
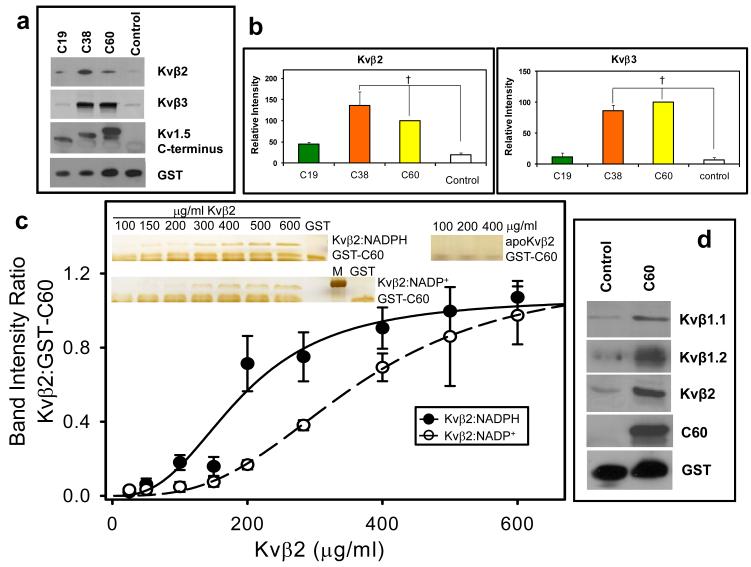
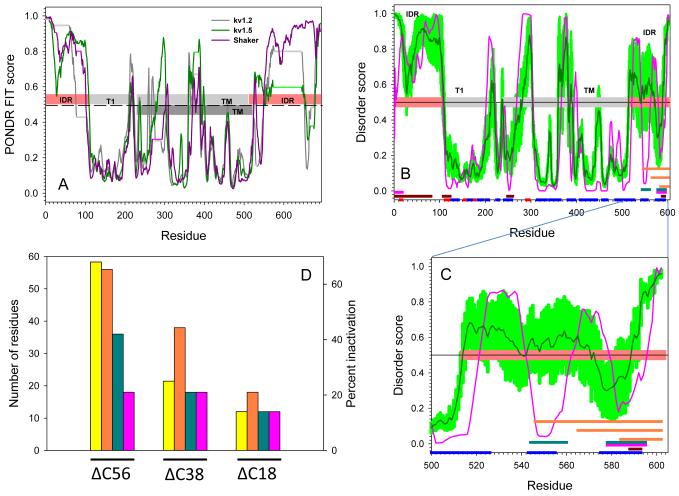
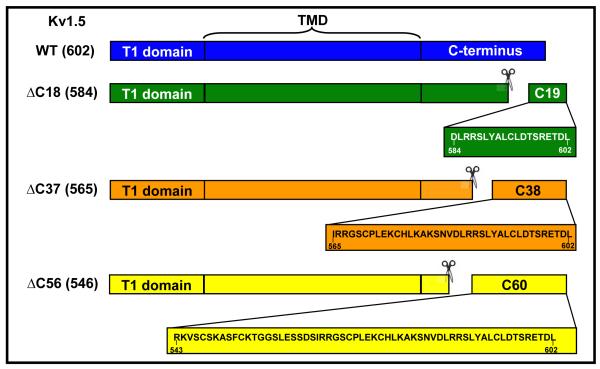
Voltage-gated potassium (Kv) channels are tetrameric assemblies of transmembrane Kv proteins with cytosolic N- and C-termini. The N-terminal domain of Kv1 proteins binds to β-subunits, but the role of the C-terminus is less clear. Therefore, we studied the role of the C-terminus in regulating Kv1.5 channel and its interactions with Kvβ-subunits. When expressed in COS-7 cells, deletion of the C-terminal domain of Kv1.5 did not affect channel gating or kinetics. Coexpression of Kv1.5 with Kvβ3 increased current inactivation, whereas Kvβ2 caused a hyperpolarizing shift in the voltage dependence of current activation. Inclusion of NADPH in the patch pipette solution accelerated the inactivation of Kv1.5-Kvβ3 currents. In contrast, NADP(+) decreased the rate and the extent of Kvβ3-induced inactivation and reversed the hyperpolarizing shift in the voltage dependence of activation induced by Kvβ2. Currents generated by Kv1.5ΔC+Kvβ3 or Kv1.5ΔC+Kvβ2 complexes did not respond to changes in intracellular pyridine nucleotide concentration, indicating that the C-terminus is required for pyridine nucleotide-dependent interactions between Kvβ and Kv1.5. A glutathione-S-transferase (GST) fusion protein containing the C-terminal peptide of Kv1.5 did not bind to apoKvβ2, but displayed higher affinity for Kvβ2:NADPH than Kvβ2:NADP(+). The GST fusion protein also precipitated Kvβ proteins from mouse brain lysates. Pull-down experiments, structural analysis and electrophysiological data indicated that a specific region of the C-terminus (Arg543-Val583) is required for Kvβ binding. These results suggest that the C-terminal domain of Kv1.5 interacts with β-subunits and that this interaction is essential for the differential regulation of Kv currents by oxidized and reduced nucleotides.


Figures

Fig. 1
Fig. 1. Expression of WT and KvΔC mutants and Kvβ3 in COS-7 cells
(a) Western blot of the microsomal fraction of COS-7 cell extracts transfected with expression constructs encoding WT Kv1.5 or its deletion mutants either alone or coexpressed with a Kvβ3 expression plasmid. Cells were harvested 48 h after transfection. (b-c) Densitometric analysis of band intensities of Kv1.5 deletion constructs (b), and Kvβ (c). Kv band intensities were normalized by the intensity of the actin band, and plotted as a percentage of the intensity obtained in the Kv1.5WT+Kvβ3 transfection.
Fig. 2
Fig. 2. Effect of Kv1.5 C-terminus deletion on Kvα-β currents
Whole-cell currents recorded from COS-7 cells cotransfected with plasmids encoding WT or ΔC56 Kv1.5 alone or coexpressed with Kvβ3. Outward currents were recorded using the patch-clamp technique (n=6-9 cells each group). Panels show representative current traces recorded with pipette containing control internal solution from cells expressing Kv1.5WT (a); or Kv1.5ΔC56 (b); Kv1.5+β3 (c); Kv1.5ΔC56+β3 (d). Representative outward currents recorded from cells transfected with WT Kv1.5+β3 with patch pipettes containing 250 μ M NADPH (e) or 1mM NADP+(g) or cells expressing ΔC56 Kv1.5+β3 with 250 μM NADPH (f) or 1mM NADP+(h) in the patch pipette. The inset on the top panel shows the pulse protocol in which the membrane potential was held at −80 mV and outward currents were generated by depolarizing the cell from −60 mV to +60mV in 10mV increments for 800 ms. Inset to each trace is depicting the α with or without the β-subunit, The C-terminus of the Kvα-subunit extending from α to the β-subunit is shown in red. Representative traces shown in panels I-L are time course effects depicting the steady-state effects of NADP+. Panels I and K shows the currents from COS-7 cells co-expressing Kv1.5 or KvΔC with Kvβ3 patched with control internal solution. Panels J and L show cells patched with solution containing NADP+ (1mM).
Fig. 3
Fig. 3. Regulation of the voltage-dependence of Kv-Kvβ current by pyridine nucleotides
Outward currents were recorded from COS-7 cells cotransfected with Kv1.5WT or Kv1.5ΔC56 with Kvβ3. (a; c) The voltage-dependence of activation was determined by normalizing outward currents at indicated voltages to +50mV; and (b; d) voltage-dependence of inactivation determined using a two pulse protocol (see Materials and Methods for details). Outward Kv currents for Kv1.5+β3 (filled square), Kvα1.5ΔC+β3 (filled circles) recorded with either the control internal solution or that containing NADPH (250μM; filled triangles) or NADP+ (1mM; inverted filled triangles). Note: In panel d, Kv1.5ΔC+ β3, inclusion of NADP+ (inverted filled triangle) did not cause change in the voltage-dependence of inactivation as compared with Kv1.5WT+ β3+NADP+ (open square). Alteration in voltage dependence of Kv current inactivation (WTKv1.5 +Kvβ3) was determined at different concentrations of NADP+ (e) and NAD+ (f). Compared to inactivation using standard pipette solution of 78% (g), addition of 1mM NAD+ to patch pipette solution decreased inactivation at 800ms in the Kv1.5WT+β3 couple to 12% (h). The recovery from inactivation for Kv1.5WT+β3 (i) and KvΔC56+β3 (j) with or without pyridine nucleotides was plotted against the interpulse interval and fitted parameters are shown in panels below.
Fig. 4
Fig. 4. Effect of C-terminal deletions on regulation of Kv1.5+Kvβ2 currents by pyridine nucleotides
COS-7 cells were transfected with Kv1.5WT or KvΔC coexpressed with Kvβ2. (a, b) The voltage-dependence of activation was determined by normalizing outward currents at indicated voltages to +50mV. Kv currents were recorded with either control internal solution or solution containing NADPH or NADP+ in the patch pipette. (c) The Vh of activation measured by the deactivating tail currents is plotted for different groups; see Material and Methods for details. *p<0.05 compared with none within each group, p<0.05 compared with WT (none) or ΔC (none) within each group.
Fig. 5
Fig. 5. Concentration effects of pyridine nucleotides
Rate constants for the fast and slow inactivation components are plotted as a function of individual pyridine nucleotide concentrations. Symbols with error bars are experimentally determined values ± SE (n=3 measurements at each nucleotide concentration); lines are best fit of the hyperbolic saturation (panels a and b) or hyperbolic competition (panels c and d) equation to the data.
Fig. 6
Fig. 6. Regulation of Kv currents by normoxic and hypoxic complement of pyridine nucleotides
COS-7 cells co-expressing Kv1.5WT+Kvβ3 or Kv1.5ΔC+Kvβ3 were used for whole-cell patch-clamp recordings (n=5-8 cells). From a holding potential of −80mV the cells were depolarized to +50mV for 800 ms. Whole cell currents were recorded in (a, c) hypoxic and (b, d) normoxic mixture of nucleotides as indicated. The hypoxic complement of pyridine nucleotides consisted of the following: NADPH 80, NADP+ 50, NADH 1000, NAD+ 200 μM and the normoxic complement of pyridine nucleotides consisted of: NADPH 100, NADP+ 30, NADH 50, NAD+ 1000 μM in the patch pipette solution. Percent inactivation was calculated as percentage difference between the peak current and that at 800 ms and depicted as bar graph showing analysis from normoxic and hypoxic complements (e). Panel f shows the kfast of inactivation measured from the currents in hypoxic and normoxic groups. (*P<0.05 Normoxic vs. hypoxic within group)
Fig. 7
Fig. 7. Effect of C-terminal deletions on regulation of Kv currents by pyridine nucleotides
COS-7 cells were transfected with Kv1.5WT or KvΔC constructs coexpressed with Kvβ3. Kv currents were recorded with either control internal solution or solution containing NADPH or NADP+ in the patch pipette. Percent inactivation was measured from the peak current to the end of 800 ms pulse at +50 mV. (a) % inactivation measured with no additives (none) or NADPH or NADP+ in the patch pipette. Inset shows the range of regulation by pyridine nucleotides calculated as a difference in the overall percent inactivation between NADPH and NADP+ groups. Rate constants of the fast (b) and the slow (c) phases of inactivation, respectively. The decay phase was analyzed by using mono- or bi-exponential equation (see Material and Methods for detail). Bars are color-coded for the deletion construct. *P<0.05 compared with no-additions (none) within each group, P<0.05 compared with WT (none), P<0.05 compared with WT (NADPH).
Fig. 8
Fig. 8. Binding of the C-terminal domain of Kv to Kvβ
(a) Western blots of Kvβ2 (upper panel) and Kvβ3 (middle panel) pulled down by the GST-Kv1.5 C-terminus fusion peptides. Fusion proteins containing 60, 38, or 19 terminal amino acid peptides from Kvα1.5 C-terminus attached to GST or GST with unrelated peptide (Control; 30μ g each) were incubated with lysate of Kvβ2 or Kvβ3 -expressing E.coli (350 μ g total protein). Protein complexes were pulled down using GST·Bind beads, washed and eluted with 10mM glutathione. The eluate was separated by SDS-PAGE and probed with anti-pan-Kvβ antibody, an antibody directed against the C-terminus of Kv1.5 (bait) or GST; (b) Densitometric analysis of the bands in panel a. The density of the Kvβ band precipitated with GST-C60 was assigned a 100% value. †, P< 0.05 versus Control peptide (n=3-5). (c) Determination of the binding affinity of Kvβ:nucleotide complexes to the C-terminal peptide of Kv1.5. A fixed concentration of GST-C60 (30 μ g/ml) was mixed with variable concentrations of Kvβ2 in a binary complex with NADPH (Kvβ2:NADPH), or NADP+ (Kvβ2:NADP+), or none (apo-Kvβ2) and GST pull down assay was performed. Eluted protein was separated by SDS-PAGE and the gels were silver stained. Band intensities normalized to GST-C60 input were plotted as a function of Kvβ2 concentration. The experiment was repeated 6 times; data points on the graph represent average and standard error, and the lines represent the best fit to experimental data using the Hill equation. Apo:Kvβ2 did not bind GST-C60 and no measurable intensities were found by silver stain. Inset: silver stained gels showing Kvβ2 in complex with NADPH, NADP+ or without nucleotide, pulled down with GST-C60; M, marker, 37 kDa band is shown. (d) Western blots of GST beads incubated with brain lysates. The GST-C60 construct or scrambled construct was used to pull down proteins from mouse brain extract. The eluate was separated on SDS PAGE and protein bands were visualized with antibodies against the indicated Kvβ isoform, Kv1.5 C-terminus, or GST.
Fig. 9
Fig. 9. Evaluation of intrinsic disorder in Kv channels
(a) Intrinsic disorder propensities of the rat Kv1.2 (dark gray line), rat Kv1.5 (dark green line), and Drosophila Shaker channel (dark pink line). In each protein, per residue disorder propensity was evaluated by PONDR® FIT algorithm. Results are shown for sequences aligned by ClustALW. All residues with disorder score higher than 0.5 (above dashed line) are predicted to be disordered; while residues with disorder score lower than 0.5 (below dashed line) are expected to be structured. Horizontal light gray, light green and light pink lines correspond to the gaps in the sequence alignment between Kv1.2, Kv1.5, and Drosophila Shaker, respectively. Light pink and gray bars in the middle of the plot show localization of the structured domain and disordered regions for Shaker Kv1.2 (PDB id: 3LUT). IDR stands for Intrinsically Disordered Region; T1 is T1 domain; TM refers to the TransMembrane domain. The transmembrane domain of Kv1.5 has been annotated as dark gray bar. Panel (b) shows the Disorder analysis and functionally important sequence features of the Kv1.5 channel. Results of the disorder prediction by PONDR® VLXT and PONDR® FIT are shown by pink and dark green lines, respectively. Light green shadow covers the distribution of errors in evaluation of disorder scores by PONDR® FIT. Three parallel orange bars at the C-terminal are locations of the three segments in deletion mutagenesis experiments. The red and blue bars at the bottom of the plot illustrate the localization of the Jpred-predicted β-strands and α-helices, respectively. Locations of the predicted α-MoRFs, AIBS, and potential VLXT-based binding sites are shown by pink, dark red and dark cyan bars, respectively. Panel (c) is an inset to Panel (b) which represents the extended view for the residue range 500-602 of the disorder distribution and functionally important sequence features in the C-terminal domain of the Kv1.5 channel. Annotations are the same as in (b). (d) Comparison of the % inactivation (yellow bars) with the length of the deleted C-terminal regions (orange bars) and the length of the deleted potential binding regions, MoRFs (pink bars) and VLXT-based binding sites (dark green bars).
Scheme I
Scheme I. Construction of Kv1 deletion mutants and GST-fusion proteins
The full-length Kv protein consists of 3 distinct domains: the N-terminus or the T1-domain, a trans-membrane domain (TMD) which forms the ion-conducting pore, and a C-terminal cytosolic loop. Deletion mutants were generated by successive deletion of 18, 37, and 58 amino acids from C-terminal end as indicated to the left of the drawings. In a separate series of experiments, peptides corresponding to the amino acid sequence spanning the last 19, 38, and 60 amino acids were expressed fused with GST.

References

    1. Barski OA, Tipparaju SM, Bhatnagar A. The aldo-keto reductase superfamily and its role in drug metabolism and detoxification. Drug Metab Rev. 2008;40(4):553–624. - PMC - PubMed
    1. Ceconi C, Bernocchi P, Boraso A, Cargnoni A, Pepi P, Curello S, Ferrari R. New insights on myocardial pyridine nucleotides and thiol redox state in ischemia and reperfusion damage. Cardiovasc Res. 2000;47(3):586–594. - PubMed
    1. Ceconi C, Bernocchi P, Boraso A, Cargnoni A, Pepi P, Curello S, Ferrari R. New insights on myocardial pyridine nucleotides and thiol redox state in ischemia and reperfusion damage. Cardiovascular research. 2000;47(3):586–594. - PubMed
    1. Cheng Y, Oldfield CJ, Meng J, Romero P, Uversky VN, Dunker AK. Mining alpha-helix-forming molecular recognition features with cross species sequence alignments. Biochemistry. 2007;46(47):13468–13477. - PMC - PubMed
    1. Cole C, Barber JD, Barton GJ. The Jpred 3 secondary structure prediction server. Nucleic Acids Res. 2008;36(Web Server issue):W197–201. - PMC - PubMed

Publication types

LinkOut - more resources