. 2012 May 1;18(9):2452-64.
doi: 10.1158/1078-0432.CCR-11-2371. Epub 2012 Mar 16.

Upregulated JAG1 enhances cell proliferation in adrenocortical carcinoma

Affiliations

Upregulated JAG1 enhances cell proliferation in adrenocortical carcinoma

Derek P Simon et al. Clin Cancer Res. .

Abstract

Purpose: The purpose of this study was to examine the expression and molecular significance of JAG1, a ligand for the Notch developmental signaling pathway, in adrenocortical carcinoma (ACC).

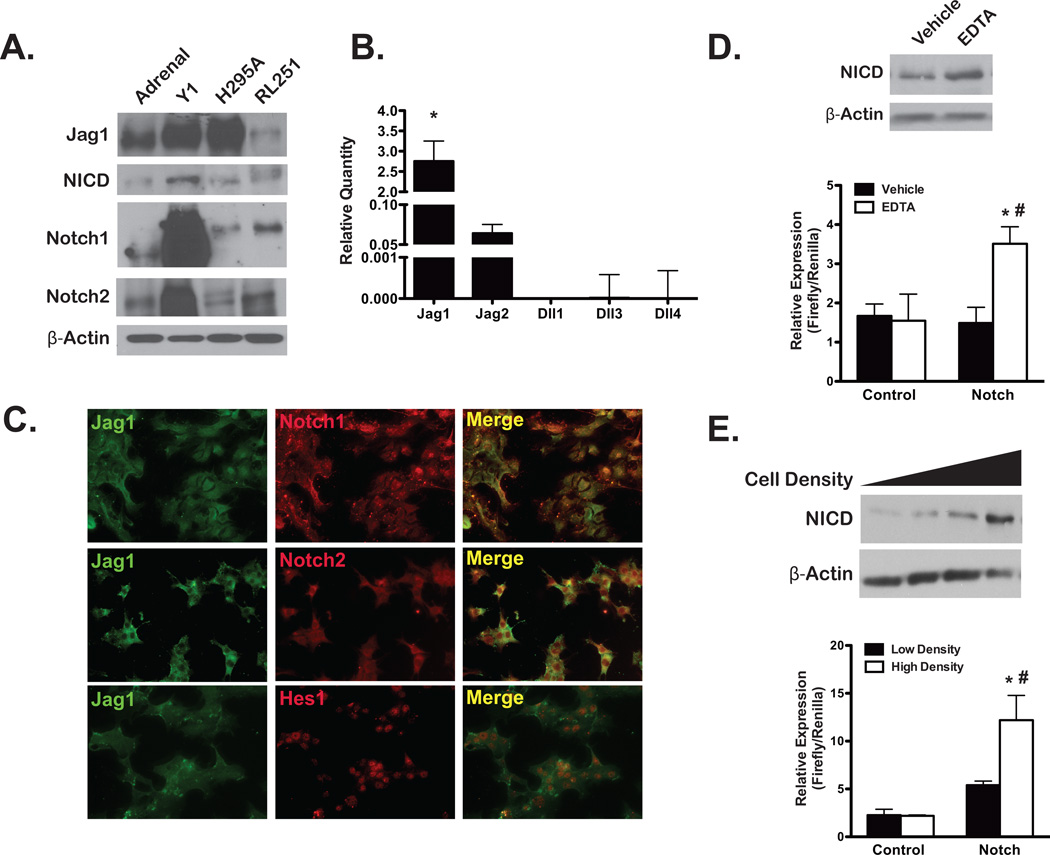
Experimental design: Human microarray data were analyzed for genes expressing ligands for the Notch pathway and validated with quantitative real-time PCR (QPCR) and immunoblots of RNA and protein, respectively. ACC cells lines were assessed for Notch pathway member expression by immunoblot, QPCR, and immunofluorescence. Notch pathway activity was also determined using a reporter gene (luciferase) activation. Proliferation experiments using a Jag1 knockdown strategy (Jag1KD) and an inhibitor of Notch-dependent transcription (DNMaml) used a coculture system with fluorescence-activated cell-sorting (FACS) analysis. Tumor stage and mitotic rate of human ACC samples were correlated to JAG1 expression.

Results: The Notch ligand JAG1 mRNA and protein are upregulated in ACCs. JAG1 upregulation can be modeled in the Y1 mouse ACC cell line that expresses Jag1, Notch receptors, downstream signaling molecules, and exhibits density-dependent Notch activation. Jag1 enhances cell proliferation through activation of canonical Notch signaling as shown through Jag1KD and coculture experiments. Inhibition of Notch signaling at the level of postreceptor signaling (DNMaml), results in similar inhibition of cell proliferation. Analysis of clinical data indicates that Jag1 expression correlates with both grade and stage of ACCs, supporting a role of JAG1-dependent Notch activation in late-stage ACCs.

Conclusions: JAG1 is the primary upregulated Notch ligand in ACCs and enhances ACC cell proliferation and tumor aggressiveness in a non-cell-autonomous manner through activation of Notch signaling in adjacent cells.


Figures

Figure 1
Figure 1
JAG1 is upregulated in human ACC. A, Heatmap of Affymetrix U133A 2.0 Plus oligonucleotide array representing Notch ligand genes. Normal Adrenal (NL), n=10, Adrenocortical Adenoma (ACA) n=22, Adrenocortical Carcinoma (ACC), n=33). Scale is indicated. B, Dot plot of two JAG1 and JAG2 probe sets. Each dot indicates one tissue sample. Lines indicate mean expression levels. JAG1 #1: ACC vs NL * p=4×10⁻⁶, ACC vs ACA # p=7×10⁻¹²), JAG1 #2: ACC vs NL** p=1×10⁻⁶, ACA vs NL ## p=2×10⁻¹¹), JAG2 #1: ACC vs NL *** p=6×10⁻⁴, ACC vs ACA ### p=4×10⁻⁴), JAG2 #2: ACC vs NL **** p=5.3×10⁻³, ACC vs ACA #### p=3×10⁻⁴). C, QPCR analysis of mRNA from randomly selected human samples (NL: n=5, ACA: n=5, ACC: n=10) for JAG1 and JAG2. Each data point represents an average of triplicate determinations. D, Correlation of Log-transformed JAG1 QPCR expression data (from Fig 1C) with the corresponding JAG1 (probe set #2) microarray data (from Fig 1B) (r=0.874, p=5×10⁻⁷) and JAG2 QPCR data with JAG2 (probe set #1) microarray data (r=0.545, p=0.013). E, Top panel: Immunoblot analysis of 5 µg of protein lysates from randomly selected human adrenal samples (NL: n=5, ACA: n=5, ACC: n=10). Blots were probed for Jagged1 and β-actin used as a loading control. Molecular weights are indicated. Bottom panel: Quantification of Immunoblots. Jag1 protein was normalized to β-Actin and then to NL sample #06. The average of two experiments is presented. Line represent mean.
Figure 2
Figure 2
The Y1 Mouse ACC Cell Line Exhibits Active Notch Signaling. A, Immunoblot analysis of 10 µg of protein lysate from WT mouse adrenal (Adrenal), mouse ACC cell line (Y1), and human ACC (H295, RL251) cell lines for Jag1, Notch1, Notch2, and NICD. β-actin is used as loading control. B, Efficiency-corrected ΔCT QPCR method of triplicate samples used to quantify the expression of the 5 Notch ligands in Y1 cells (* JAG1 vs JAG2, p=0.00001). Representative experiment of three repetitions. C, Immunofluorescent colocalization of Jag1 with Notch1, Notch2, and Hes1 in Y1 cells. D, Top panel: Immunoblot analysis of 10 µg of protein lysate from Y1 cells treated with 5mM EDTA or vehicle (PBS) for 6h. Blots were probe for NICD and β-actin, used as loading control. Bottom panel: Luciferase assay of triplicate samples of Notch (4xwtCBF1Luc; pJH23A) and Control (4xmtCBF1Luc; pJH25A) reporter in Y1 cells treated with 5mM EDTA or vehicle for 6h. Luciferase expression is normalized to p-RL-TK Renilla expression (EDTA, Notch: * vs EDTA, Control p=0.004, # vs Vehicle, Notch p=0.0039). Representative experiment of three repetitions. E, Top panel: Immunoblot analysis of NICD levels of 10 µg of protein lysates of Y1 cells grown at 10%, 25%, 50%, 90% confluence. β-actin is used as loading control. Bottom panel: Luciferase assay of triplicate samples of Notch and Control reporter expression (normalized to Renilla) in Y1 cells grown at 10% (low density) and 90% (high density) confluence (High density, Notch: * vs High density, Control p=0.00003, # vs Low density, Notch p=0.0006). Representative experiment of three repetitions.
Figure 3
Figure 3
Jag1 knockdown in Y1 cells inhibits proliferation in a density-dependent manner. A, Immunoblot analysis of protein lysates from stable cell lines expressing shRNAs for either Scramble or Jag1 [Scramble (GFP+) and Jag1KD (GFP+) respectively]. Blots were probed for Jag1 and β-actin, used as loading control. B, QPCR analysis of mRNA from Scramble (GFP+) and Jag1KD (GFP+) stable cell lines analyzed by the ΔΔCT method, and normalized to β-actin [Scramble (GFP+) vs Jag1KD (GFP+): * Jag1 p=0.0002, # Hes1 p=0.001]. Representative experiment of five repetitions. Absorbance values obtained from MTS viability assay on cell lines [Scramble (GFP+) vs Jag1KD (GFP+)] plated at (C) 10% confluence at Day 1 and growth to 35% confluence by Day 4 and (D) 40% confluence at Day1 and growth to 85% by Day 4, Scramble (GFP+) vs Jag1KD (GFP+) at Day 4, * p=0.0045. Each data point represents an average ± SD of 6 determinations. Representative experiment of four repetitions.
Figure 4
Figure 4
Jag1 enhances ACC proliferation in a non-cell-autonomous manner. A, Schematic indicating experimental design. dsRedII+ (normal Y1) cells were co-cultured with GFP+ (Scramble or Jag1KD) cells in ratios 90% Red+/10% GFP+, or 10% Red+/90% GFP+. Initial combined cell number (Red+ plus GFP+) was 150,000 cells and triplicate wells were plated. The same initial plating was used for each time point and cells were plated 4 days from harvest for the Day 4 timepoint, 3 Days from the harvest for the Day 3 timepoint, etc. Harvested cells were analyzed by FACS. 10,000 sorted cells were counted for each timepoint and the number of Red+ and GFP+ determined for each count. The percentage change in cell number from Day 1 was determined by the formulas indicated and based on the 10,000 cells counted for each time point. B, Immunocytochemical images of the two different co-culture conditions at Day 2. C, Top panel: The percentage change of Red+ cells from Day 1 for each timepoint in the 90% Red+/10% GFP+ condition. Bottom panel: The percentage change of GFP+ cells from Day 1 for each timepoint in the 90% Red+/10% GFP+ condition. D, Top panel: The percentage change of Red+ cells from Day 1 for each timepoint in the 10% Red+/90% GFP+ condition (* p<0.03). Bottom panel: The percentage change of GFP+ cells from Day 1 for each timepoint in the 10% Red+/90% GFP+ condition. Scramble (GFP+) vs Jag1KD (GFP+) at Day 2, 3, and 4, * p<0.0001). Each bar represents an average ± SD of 3 determinations. Representative experiment of three repetitions.
Figure 5
Figure 5
DNMaml suppression of Notch-dependent transcription reduces Y1 cell proliferation to a similar degree as Jag1 Knockdown. A, QPCR of mRNA from stable cells lines expressing either Control (GFP+) or DNMaml (GFP+) constructs analyzed using the ΔΔCT method and normalized to β-actin [Control (GFP=) vs DNMaml (GFP+): Hes1 * p=0.0001, Cdkn1a # p=0.02]. B, Absorbance values obtained from MTS viability assay on cell lines [Control (GFP+) vs DNMaml (GFP+), * p<0.0001]. Each data point represents an average ± SD of 6 determinations. Representative experiment of four repetitions. Co-culture of 50% normal Y1 cells (Red+) and either 50% Control (GFP+) or 50% DNMaml cells (GFP+). Initial combined cell number (Red+ plus GFP+) was 150,000 cells and triplicate wells were plated. The same initial plating was used for each time point and cells were plated 4 days from harvest for the Day 4 timepoint, 3 Days from the harvest for the Day 3 timepoint, etc. Harvested cells were analyzed by FACS. 10,000 cells were counted for each timepoint and the number of Red+ and GFP+ determined for each count. The percentage change in cell number from Day 1 was determined by the formulas indicated (y-axis) and based on the 10,000 cells counted for each time point, C, Left panel: The percentage change of Red+ cells from Day 1 for each timepoint. Right panel: mRNA was harvested from Red+ cells at the Day 4 timepoint for the Control and DNMaml co-culture. Hes1 expression was determined by the ΔΔCT method and normalized to β-actin. D, Left panel: The percentage change of GFP+ cells from Day 1 for each timepoint [Control (GFP+) vs DNMaml (GFP+), * p<0.0001, # p=0.06]. Right panel: mRNA was harvested from GFP+ cells at the Day 4 timepoint for the Control and DNMaml co-culture. Hes1 expression was determined by the ΔΔCT method and normalized to β-actin (* p=0.0066). Each bar represents an average ± SD of 3 determinations. Representative experiment of three repetitions.
Figure 6
Figure 6
JAG1 expression is highest in aggressive, highly proliferating ACC. A, Correlation of JAG1 expression (base-2 log transformed) for stage in ACCs (n=33). 19 Stage I + II vs 14 Stage III + IV p=0.0551, overall correlation r=0.35, p=0.04. B, Correlation of JAG1 expression (base-2 log transformed) with mitotic rate (base-2 log transformed). Overall correlation r=0.40, p=0.02. C, Correlation of JAG1 expression (base-2 log transformed) with KI67 expression (base-2 log transformed) across all human adrenal samples used in the microarray data set. Overall correlation r = 0.62, p<0.0001. D, Correlation of JAG1 expression (base-2 log transformed) with TOP2A expression (base-2 log transformed) across all human adrenal samples used in the microarray data set. Overall correlation r=0.69, p<0.0001.

References

    1. Wajchenberg BL, Albergaria Pereira MA, Medonca BB, Latronico AC, Campos Carneiro P, Alves VA, et al. Adrenocortical carcinoma: clinical and laboratory observations. Cancer. 2000;88(4):711–736. - PubMed
    1. Guerrieri M, De Sanctis A, Crosta F, Arnaldi G, Boscaro M, Lezoche G, et al. Adrenal incidentaloma: surgical update. J Endocrinol Invest. 2007;30(3):200–204. - PubMed
    1. Icard P, Goudet P, Charpenay C, Andreassian B, Carnaille B, Chapuis Y, et al. Adrenocortical carcinomas: surgical trends and results of a 253-patient series from the French Association of Endocrine Surgeons study group. World J Surg. 2001;25(7):891–897. - PubMed
    1. Vassilopoulou-Sellin R, Schultz PN. Adrenocortical carcinoma. Clinical outcome at the end of the 20th century. Cancer. 2001;92(5):1113–1121. - PubMed
    1. Tissier F, Cavard C, Groussin L, Perlemoine K, Fumey G, Hagnere AM, et al. Mutations of beta-catenin in adrenocortical tumors: activation of the Wnt signaling pathway is a frequent event in both benign and malignant adrenocortical tumors. Cancer Res. 2005;65(17):7622–7627. - PubMed

Publication types

MeSH terms