Comparative Study
. 2012 Apr 24;53(4):2133-41.
doi: 10.1167/iovs.11-8755.

Signal quality assessment of retinal optical coherence tomography images

Affiliations
Comparative Study

Signal quality assessment of retinal optical coherence tomography images

Yijun Huang et al. Invest Ophthalmol Vis Sci. .

Abstract

Purpose: The purpose of this article was to assess signal quality of retinal optical coherence tomography (OCT) images from multiple devices using subjective and quantitative measurements.

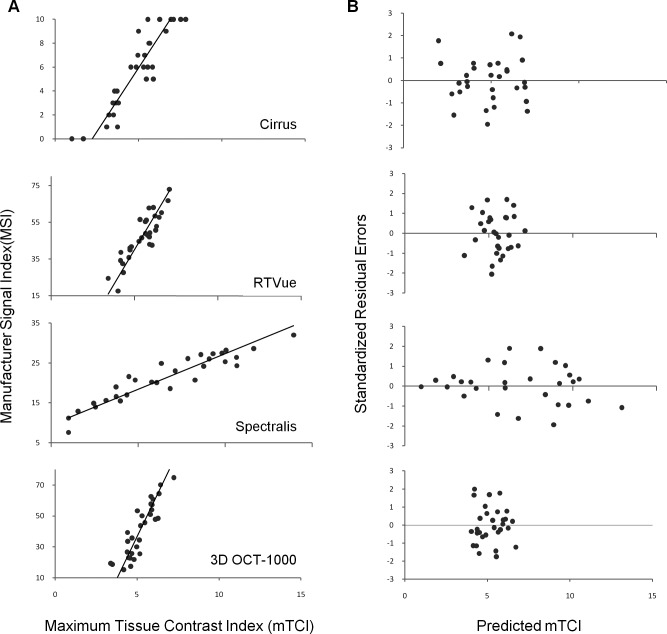
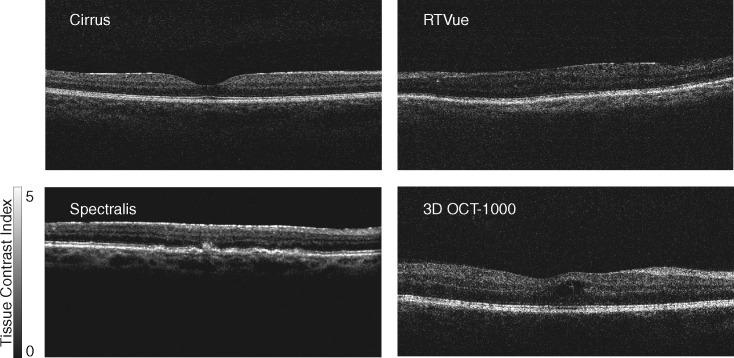
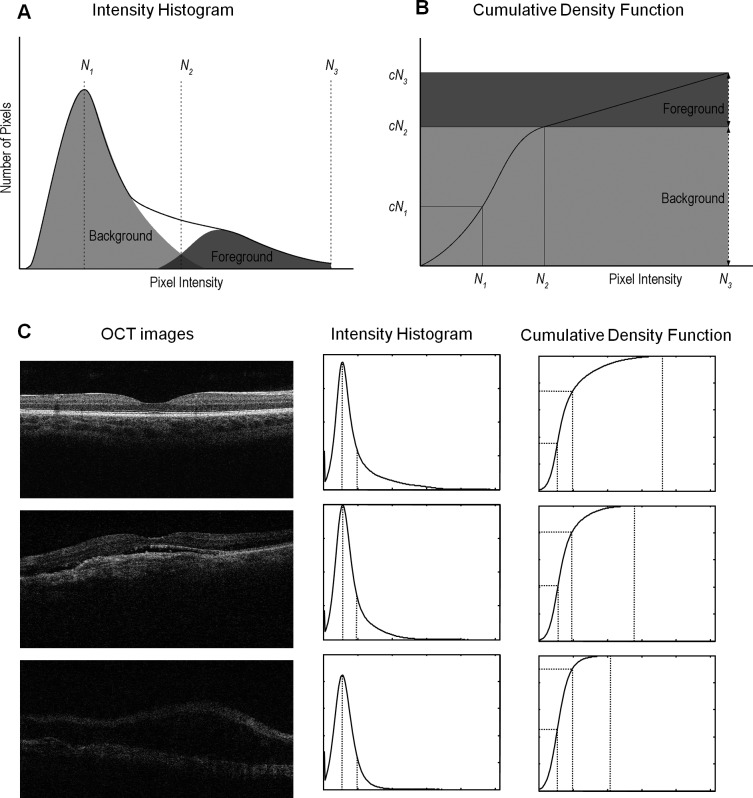
Methods: A total of 120 multiframe OCT images from 4 spectral domain OCT devices (Cirrus, RTVue, Spectralis, and 3D OCT-1000) were evaluated subjectively by trained graders, and measured quantitatively using a derived parameter, maximum tissue contrast index (mTCI). An intensity histogram decomposition model was proposed to separate the foreground and background information of OCT images and to calculate the mTCI. The mTCI results were compared with the manufacturer signal index (MSI) provided by the respective devices, and to the subjective grading scores (SGS).

Results: Statistically significant correlations were observed between the paired methods (i.e., SGS and MSI, SGS and mTCI, and mTCI and MSI). Fisher's Z transformation indicated the Pearson correlation coefficient ρ ≥ 0.8 for all devices. Using the Deming regression, correlation parameters between the paired methods were established. This allowed conversion from the proprietary MSI values to SGS and mTCI that are universally applied to each device.

Conclusions: The study suggests signal quality of retinal OCT images can be evaluated subjectively and objectively, independent of the devices. Together with the proposed histogram decomposition model, mTCI may be used as a standardization metric for OCT signal quality that would affect measurements.


Conflict of interest statement

Disclosure: R. Klein, Topcon Inc. (R); Y. Huang, None; S. Gangaputra, None; K.E. Lee, None; A.R. Narkar, None; B.E.K. Klein, None; S.M. Meuer, None; R.P Danis, None

Figures

Figure 1.
Figure 1.
A representative OCT image with subjective grading scheme applied. The graded OCT features were labeled (a) vitreous, (b) vitreo-retinal interface, (c) nerve fiber layer, (d) ganglion cell layer, (e) plexiform layers, (f) outer nuclear layer, (g) outer limiting membrane, (h) outer retino-choroidal complex, (i) choroidal/scleral interface. Question 1 in the subjective grading scheme corresponds to the intensity difference between features a and h; question 2, visibility of b; question 3, intensity difference between a and c; question 4, intensity difference between a and e; question 5, visibility of multiple layers within h; question 6, visibility of d (against c and e); question 7, intensity difference between a and f; question 8, visibility of g; and question 9, visibility of i.
Figure 2.
Figure 2.
Subjective assessment of OCT signal quality. (A) Kappa analysis of intergrader reproducibility of the SGS. (B) Scatter plot of the SGS and MSI values. Solid line shows the linear relationship determined by Deming regression. (C) Scatter plot of the standardized residual errors and the predicted SGS. The standardized residual errors were the orthogonal distances of all data points from the regression line, normalized by its standard deviation.
Figure 3.
Figure 3.
Comparison of the SGS and the mTCI values. (A) Scatter plot of the mTCI and SGS values. Solid line shows Deming regression. (B) Scatter plot of the standardized residual errors and the predicted SGS.
Figure 4.
Figure 4.
Comparison of quantitative measurement of OCT signal quality using mTCI and MSI. (A) Scatter plot of the mTCI and MSI values. Solid line shows Deming regression. (B) Scatter plot of the standardized residual errors and the predicted mTCI.
Figure 5.
Figure 5.
Representative OCT B-scans from four spectral domain-OCT devices were converted using the tissue contrast index, and displayed in the same gray scale. The mTCI measurements of these images are 5.00, 5.12, 4.87, and 4.92, respectively. Pixel intensity was mapped to a range varying from black (TCI = 0) to white (TCI = 5).
Figure A1.
Figure A1.
Histogram density modeling and decomposition of an OCT image. (A) Schematic drawing of the intensity histogram of an OCT image. Solid line shows the envelope of the histogram, and dotted lines show the relative composition between background and foreground pixels. N1, N2, and N3 denote the signal intensity values of the mode point, the separation point between background and foreground, and the saturation point. (B) Schematic drawing of the cumulative density function (CDF) of an OCT image. N1, N2, and N3 and cN1, cN2, and cN3 denote the signal intensity and cumulative density values of the mode point, the separation point between background and foreground, and the saturation point. (C) Three representative OCT images with strong, moderate, and weak signals, and their associated intensity histogram and cumulative density functions. The mTCI values of these three images (from strong to weak) are 6.95, 5.55, and 3.50, respectively.

References

    1. Fujimoto J, Bouma B, Tearney G, et al. New technology for high speed and high resolution optical coherence tomography. Ann N Y Acad Sci. 1998;838:95–107. - PubMed
    1. van Velthoven ME, Faber DJ, Verbraak FD, van Leeuwen TG, de Smet MD. Recent developments in optical coherence tomography for imaging the retina. Prog Retin Eye Res. 2007;26:57–77. - PubMed
    1. Giani A, Cigada M, Choudhry N, et al. Reproducibility of retinal thickness measurements on normal and pathologic eyes by different optical coherence tomography instruments. Am J Ophthalmol. 2010;150:815–824. - PubMed
    1. Geitzenauer W, Kiss C, Durbin M, et al. Comparing retinal thickness measurements from cirrus spectral domain-and stratus time domain-optical coherence tomography. Retina. 2010;30:596–606. - PubMed
    1. Cheung CYL, Leung CKS, Lin D, Pang CP, Lam DSC. Relationship between retinal nerve fiber layer measurement and signal strength in optical coherence tomography. Ophthalmology. 2008;115:1347–1351. - PubMed

Publication types

MeSH terms