. 2012 May 4;287(19):15380-94.
doi: 10.1074/jbc.M112.339580. Epub 2012 Mar 16.

Hormone-induced 14-3-3γ adaptor protein regulates steroidogenic acute regulatory protein activity and steroid biosynthesis in MA-10 Leydig cells

Affiliations

Hormone-induced 14-3-3γ adaptor protein regulates steroidogenic acute regulatory protein activity and steroid biosynthesis in MA-10 Leydig cells

Yasaman Aghazadeh et al. J Biol Chem. .

Abstract

Cholesterol is the sole precursor of steroid hormones in the body. The import of cholesterol to the inner mitochondrial membrane, the rate-limiting step in steroid biosynthesis, relies on the formation of a protein complex that assembles at the outer mitochondrial membrane called the transduceosome. The transduceosome contains several mitochondrial and cytosolic components, including the steroidogenic acute regulatory protein (STAR). Human chorionic gonadotropin (hCG) induces de novo synthesis of STAR, a process shown to parallel maximal steroid production. In the hCG-dependent steroidogenic MA-10 mouse Leydig cell line, the 14-3-3γ protein was identified in native mitochondrial complexes by mass spectrometry and immunoblotting, and its levels increased in response to hCG treatment. The 14-3-3 proteins bind and regulate the activity of many proteins, acting via target protein activation, modification and localization. In MA-10 cells, cAMP induces 14-3-3γ expression parallel to STAR expression. Silencing of 14-3-3γ expression potentiates hormone-induced steroidogenesis. Binding motifs of 14-3-3γ were identified in components of the transduceosome, including STAR. Immunoprecipitation studies demonstrate a hormone-dependent interaction between 14-3-3γ and STAR that coincides with reduced 14-3-3γ homodimerization. The binding site of 14-3-3γ on STAR was identified to be Ser-194 in the STAR-related sterol binding lipid transfer (START) domain, the site phosphorylated in response to hCG. Taken together, these results demonstrate that 14-3-3γ negatively regulates steroidogenesis by binding to Ser-194 of STAR, thus keeping STAR in an unfolded state, unable to induce maximal steroidogenesis. Over time 14-3-3γ homodimerizes and dissociates from STAR, allowing this protein to induce maximal mitochondrial steroid formation.


Figures
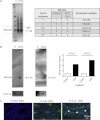
FIGURE 1.
FIGURE 1.
Presence of 14-3-3γ in native complexes of MA-10 cell mitochondria and testis of adult mouse. A, BN-PAGE of native mitochondrial complexes from control and hCG-treated cells is shown. Mass spectrometry analysis indicated the presence of the 14-3-3 family of proteins in the mitochondrial 66-kDa complexes. The presence of the proteins in control versus hCG-treated cells is shown as mass spectrometry (MS) hits in the second and third column. B, BN-PAGE followed by dry transferring to PVDF membranes indicates the presence of 14-3-3γ and -ϵ in MA-10 cell mitochondria before and after hCG stimulation for 2 h. Relative expression of 14-3-3γ compared with the mitochondrial protein control cytochrome c oxidase (COXIV) is shown in the bar graph. C, immunohistochemistry of adult mouse testis sections shows the expression of 14-3-3γ in interstitial cells.
FIGURE 2.
FIGURE 2.
The transcription and expression pattern of 14-3-3γ is similar to that of STAR. MA-10 cells were stimulated with 1 mm cAMP in a time-course with the indicated time points. A, protein levels of STAR (white bars) and 14-3-3γ (gray bars) were assessed by immunoblot analysis. Representative immunoblots from three independent experiments show 14-3-3γ, STAR, and control GAPDH protein levels at 0, 30, 60, and 120 min after cAMP treatment. A.U., absorbance units. B, levels of mRNA of both STAR (white bars) and 14-3-3γ (gray bars) were assessed by qPCR in triplicate. GAPDH mRNA levels were used for normalization. Results shown are the means ± S.D. from three independent experiments performed in triplicates. C, MA-10 cells were treated with the transcription inhibitor actinomycin D (10 μg/ml) and cAMP (1 mm). At the indicated time points cells were collected, and the expression levels of 14-3-3γ, STAR, and the control GAPDH were assessed by immunoblot analysis. Representative immunoblots from three independent experiments show 14-3-3γ, STAR, and control GAPDH protein levels at 0, 30, 60, and 120 min after cAMP treatment. D, localization of 14-3-3γ in MA-10 cells by immunocytochemistry is shown. DAPI, Alexa Fluor 488, and Alexa Fluor 555 were used to indicate nuclei, 14-3-3γ, and mitochondrial cytochrome c oxidase, respectively. The merge channel indicates that 14-3-3γ partially colocalizes with mitochondria.
FIGURE 3.
FIGURE 3.
Role of 14-3-3γ in steroidogenesis. A, MA-10 cells were treated with different concentrations of 14-3-3γ isoform-specific siRNA and analyzed by immunoblot analysis. A representative immunoblot from three independent experiments is shown. A.U., absorbance units. HPRT, hypoxanthine-guanine phosphoribosyltransferase. B, time-course treatment of MA-10 cells with 1 mm cAMP followed by RIA to measure progesterone levels in control cells (white bars), cells transfected with 20 nm scrambled siRNA (light gray bars), and cells treated with 20 nm 14-3-3γ siRNA (dark gray bars) is shown. C, data obtained in B was further analyzed to assess the rate of progesterone synthesis between the indicated time points (0–30, 30–60, and 60–120 min). D, time-course treatment of MA-10 cells with 50 ng/ml hCG is shown. Data obtained was analyzed to assess the rate of progesterone synthesis between the indicated time points (0–30, 30–60, and 60–120 min). Results shown are means ± S.D. from at least three independent experiments performed in triplicate.
FIGURE 4.
FIGURE 4.
In silico and in vitro identification of 14-3-3 target proteins in the transduceosome complex. A, in silico analysis shows the presence of suboptimal 14-3-3 binding motifs of mode I and II in STAR, VDAC, PKARIα, and ABCD3. B, MA-10 cells were treated with 1 mm cAMP. Cross-linking was performed using photoactivatable amino acids in cell culture media and exposure to UV light after cAMP stimulation as indicated under “Experimental Procedures.” Approximately 0.5 mg protein was co-immunoprecipitated (IP) with 14-3-3γ antibody followed by immunoblot analysis (IB) using antibodies for TSPO, VDAC, ABCD3, PKARIα, and 14-3-3ζ. C. Treatments were performed as described above (B), and STAR antibody was used to study binding between STAR and 14-3-3γ. D, treatments were performed as described above (B), and the homodimerization pattern of 14-3-3γ was studied by using the same antibody for both co-immunoprecipitation of 0.1 mg of protein and immunoblot. In C and D relative expression of proteins was analyzed as described under “Experimental Procedures.” All results shown are representative of at least three independent experiments. A.U., absorbance units. Cross-linked samples are indicated as CL and not cross-linked as NCL.
FIGURE 5.
FIGURE 5.
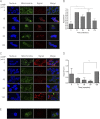
Confirmation of STAR-14-3-3γ interactions using Duolink technology. A, MA-10 cells were treated with 1 mm cAMP in a time-course as indicated. Duolink technology was performed using rabbit anti-STAR antibody and mouse anti-14-3-3γ antibody followed by the addition of proximity ligation assay probes. The red fluorescent tag was used to detect 14-3-3γ-STAR interactions, Hoechst for nuclei staining, and Mito-ID for mitochondrial staining. B, the signal per cell ratio was assessed for each time point using Olink software and normalized to the time point with the maximum interaction (15 min). C and D, a similar experiment was performed using two 14-3-3γ antibodies, raised in mouse and rabbit. The signal per cell ratio was measured and compared with that of the time point with the highest ratio (120 min). E, the experiment was performed as before, only in the absence of primary antibody to indicate background staining. Results shown are representative of at least three independent experiments.
FIGURE 6.
FIGURE 6.
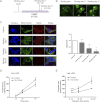
Identification of the 14-3-3γ binding site on STAR. A, the 14-3-3 binding motif mode I (residues 52–57) and mode II (residues 181–187 and 191–196) were detected in silico on STAR. Peptides containing a TAT peptide sequence followed by each of the 14-3-3 motifs on STAR were synthesized (Table 3). B, peptide labeling using Oregon Green 488 shows that TAT peptide sequences easily penetrate the MA-10 cell membrane and enter the cytoplasm, therefore acting as a shuttle for the 14-3-3 binding motifs on STAR. C, MA-10 cells were treated with 1 mm cAMP for 15 min to induce maximal STAR-14-3-3γ interactions. The top panel shows the control cells. In the second, third, and fourth panel, cells were treated for 90 min with 250 nm concentrations of the first, second, and third peptides, respectively, followed by 15 min of cAMP treatment. Duolink was performed using mouse anti-14-3-3γ antibody and rabbit anti-STAR antibody. The signal per cell was measured and normalized to the control, indicating that only peptide three significantly competes with STAR interaction with 14-3-3γ and blocks this interaction. D, levels of progesterone were measured in MA-10 cells treated with 250 nm of the STAR-competing peptides. Cells were treated with cAMP for 15–60 min to induce STAR-14-3-3γ binding, and progesterone levels were measured. E, data obtained in D were analyzed to assess the rate of progesterone synthesis between the indicated time points (0–15, 15–30, and 30–60 min). Results shown are the means ± S.D. from at least three independent experiments performed in triplicate. Binding site I, II, and III indicate the corresponding peptide I, II, and III used.
FIGURE 7.
FIGURE 7.
Proposed model for the negative regulatory role of 14-3-3γ in steroidogenesis. A, under basal conditions, 14-3-3γ is present in the form of homodimers. B, after 15 min of cAMP treatment, PKA gets activated, and 14-3-3γ homodimers dissociate, resulting in increased levels of 14-3-3γ monomers. 14-3-3γ monomers bind to STAR at residues 191–196 in the START domain and block the PKA consensus for Ser-194 phosphorylation. Thus, STAR is maintained at partial rather than maximal activity. C, at 60 min of cAMP treatment, the levels of both STAR and 14-3-3γ are increased significantly through translation of pre-existing mRNA. D, at 2 h of stimulation, 14-3-3γ levels are further increased leading to homodimerization, which likely carries out a dominant negative role for 14-3-3γ function. As a result, 14-3-3γ dissociates from STAR, allowing Ser-194 to be phosphorylated by PKARIα and further inducing STAR activity required for maximal steroidogenesis.

References

    1. Stocco D. M., Clark B. J. (1996) Regulation of the acute production of steroids in steroidogenic cells. Endocr. Rev. 17, 221–244 - PubMed
    1. Bakker G. H., Hoogerbrugge W., Rommerts F. F., van der Molen H. J. (1983) LH-dependent steroid production and protein phosphorylation in culture of rat tumor Leydig cells. Mol. Cell. Endocrinol. 33, 243–253 - PubMed
    1. Pon L. A., Orme-Johnson N. R. (1986) Acute stimulation of steroidogenesis in corpus luteum and adrenal cortex by peptide hormones. Rapid induction of a similar protein in both tissues. J. Biol. Chem. 261, 6594–6599 - PubMed
    1. Papadopoulos V., Liu J., Culty M. (2007) Is there a mitochondrial signaling complex facilitating cholesterol import? Mol. Cell. Endocrinol. 265, 59–64 - PubMed
    1. Rone M. B., Fan J., Papadopoulos V. (2009) Cholesterol transport in steroid biosynthesis. Role of protein-protein interactions and implications in disease states. Biochim. Biophys. Acta 1791, 646–658 - PMC - PubMed

Publication types

MeSH terms