. 2012 May 4;287(19):15580-9.
doi: 10.1074/jbc.M111.315218. Epub 2012 Mar 16.

Chaperone insufficiency links TLR4 protein signaling to endoplasmic reticulum stress

Affiliations

Chaperone insufficiency links TLR4 protein signaling to endoplasmic reticulum stress

Andressa Coope et al. J Biol Chem. .

Retraction in

Abstract

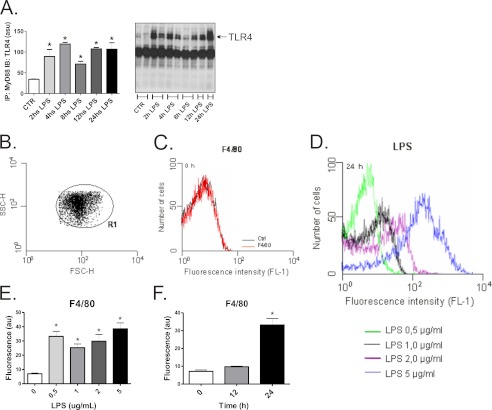
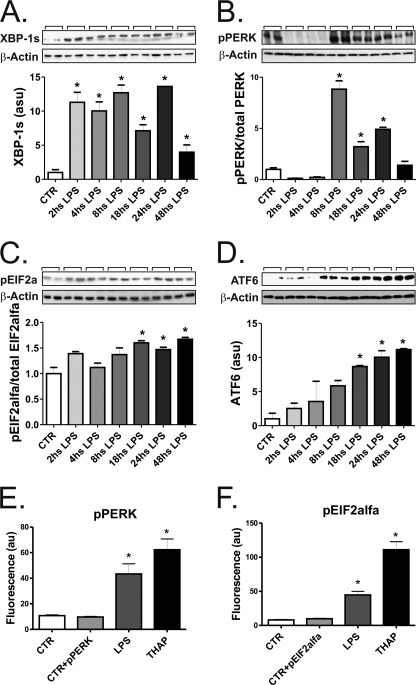
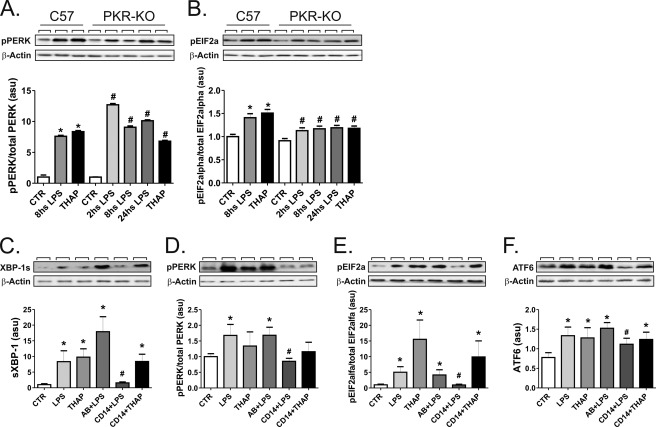
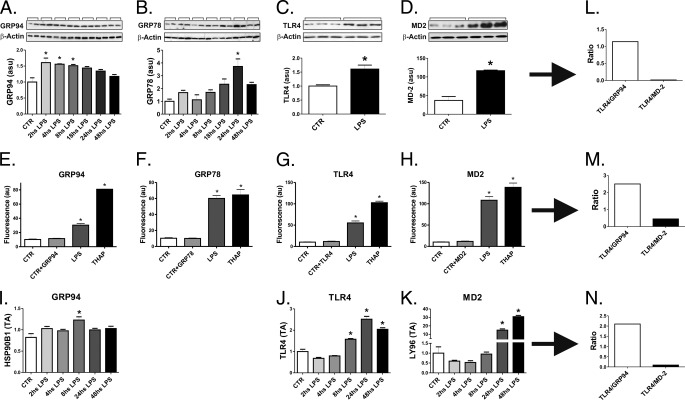
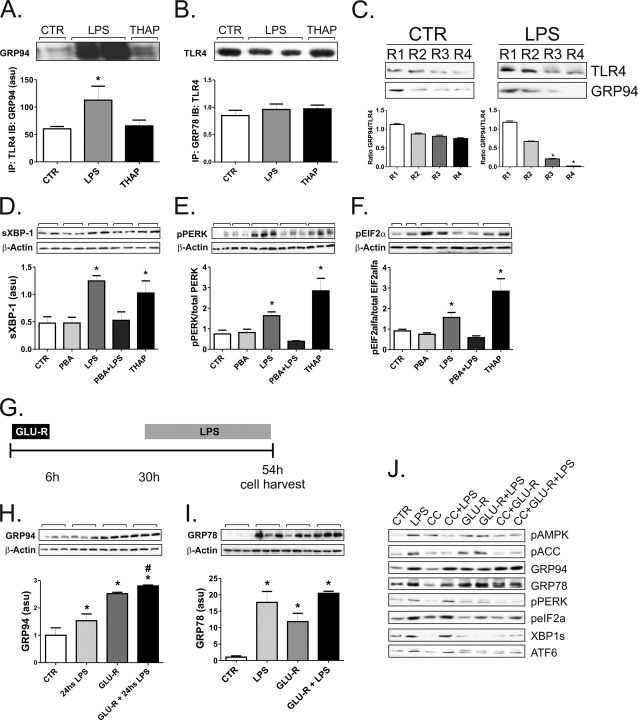
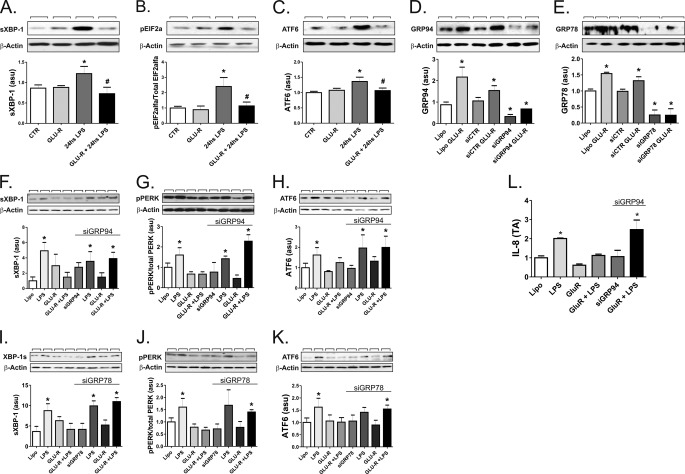
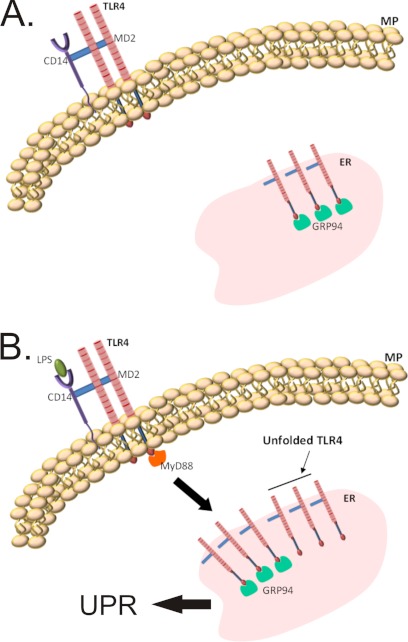
Inflammation plays an important pathogenic role in a number of metabolic diseases such as obesity, type 2 diabetes, and atherosclerosis. The activation of inflammation in these diseases depends at least in part on the combined actions of TLR4 signaling and endoplasmic reticulum stress, which by acting in concert can boost the inflammatory response. Defining the mechanisms involved in this phenomenon may unveil potential targets for the treatment of metabolic/inflammatory diseases. Here we used LPS to induce endoplasmic reticulum stress in the human monocyte cell-line, THP-1. The unfolded protein response, produced after LPS, was dependent on CD14 activity but not on RNA-dependent protein kinase and could be inhibited by an exogenous chemical chaperone. The induction of the endoplasmic reticulum resident chaperones, GRP94 and GRP78, by LPS was of a much lower magnitude than the effect of LPS on TLR4 and MD-2 expression. In face of this apparent insufficiency of chaperone expression, we induced the expression of GRP94 and GRP78 by glucose deprivation. This approach completely reverted endoplasmic reticulum stress. The inhibition of either GRP94 or GRP78 with siRNA was sufficient to rescue the protective effect of glucose deprivation on LPS-induced endoplasmic reticulum stress. Thus, insufficient LPS-induced chaperone expression links TLR4 signaling to endoplasmic reticulum stress.


Figures

FIGURE 1.
FIGURE 1.
LPS-induced activation of TLR4 signaling in THP-1 cells. THP-1 cells were exposed for 2–24 h to 0.5 μg/ml LPS, and protein extracts were obtained for immunoprecipitation (IP) using anti-MyD88 antibody and immunoblotting (IB) using anti-TLR4 antibody (A). The homogeneity of the cell preparation was evaluated by flow cytometry, as determined by the forward scatter (FSC-H) and the side scatter (SSC-H) (B), and the homogeneous cell preparation is shown in R1. The basal (C) as well as the LPS (D–F)-stimulated expressions of F4/80 were evaluated by flow cytometry; cells were exposed to 0.5–5.0 μg/ml LPS for 24 h (D and E). au, absorbance units. In F, cells were exposed to 0.5 μg/ml LPS and harvested after 0, 12, or 24 h. In all experiments, n = 6. In A: *, p < 0.05 versus CTR; in E and F: *, p < 0.05 versus LPS 0 μg/ml and time 0 h, respectively.
FIGURE 2.
FIGURE 2.
LPS induces ERS in THP-1 cells. In all experiments, cells were exposed to 0.5 μg/ml LPS and harvested at times depicted in the panels (A–D) or after 24 h (E and F). In A–D, protein extracts were separated by SDS-PAGE and immunoblotted with anti-spliced XBP1 (A), pPERK (B), peIF2α (C), or ATF6 (D) antibodies. All membranes were stripped and reblotted with anti-β-actin antibody. In E and F, the expressions of pPERK (E) and peIF2α (F) were evaluated by flow cytometry. Controls were labeled or not with the specific antibodies, CTR+(pPERK or peIF2α), or CTR, respectively. For the flow cytometry evaluation some groups of cells were treated with thapsigargin (THAP). In all experiments, n = 6. *, p < 0.05 versus CTR.
FIGURE 3.
FIGURE 3.
Inhibition of CD14, but not of PKR, reverses LPS-induced ERS. In A and B, C57 or PKR-KO mice were treated intraperitoneally with 200 μl of saline (CTR), LPS (3.0 mg/kg), or thapsigargin (2.5 mg/kg) (THAP), and the spleen was removed after 2, 8, or 24 h. Protein extracts were separated by SDS-PAGE and immunoblotted with antibodies against pPERK (A) or peIF2α (B). In C–F, cells were maintained under steady-state conditions (CTR) or treated with LPS, thapsigargin, preimmune serum + LPS (AB+LPS), anti-CD14 antibody + LPS (CD14+LPS), or anti-CD14 antibody + thapsigargin (CD14+THAP). Protein extracts were separated by SDS-PAGE and immunoblotted with anti-spliced XBP1 (C), pPERK (D), peIF2α (E), or ATF6 (F) antibodies. All membranes were stripped and reblotted with anti-β-actin antibody. In all experiments n = 6. In A and B: *, p < 0.05 versus CTR-C57; #, p < 0.05 versus CTR-PKR-KO. In C–F: *, p < 0.05 versus CTR; #, p < 0.05 versus LPS. asu, arbitrary scanning units.
FIGURE 4.
FIGURE 4.
LPS induces only a discrete increase of GRP94 and GRP78 in THP-1 cells. In A–D and I–K, cells were maintained under steady-state conditions (CTR) or treated with LPS (0.5 μg/ml) for 2–48 h (A and B and I–K) or for 24 h (C and D). In A–D, protein extracts were separated by SDS-PAGE and immunoblotted with anti-GRP94 (A), GRP78 (B), TLR4 (C), or MD-2 (D) antibodies. All membranes were stripped and reblotted with anti-β-actin. In E–H, the expressions of GRP94 (E), GRP78 (F), TLR4 (G), and MD-2 (H) were evaluated by flow-cytometry. Controls were labeled or not with specific antibodies, CTR+(GRP94, GRP78, TLR4, or MD-2) or CTR, respectively. In I–K, real-time PCR was used to determine the expressions of GRP94 (I), TLR4 (J), and MD-2 (K). In L–N, estimations of the TLR4/GRP94 and TLR4/MD-2 ratios were obtained at the time points when maximum GRP94 or MD-2 expressions were obtained. In all experiments, n = 6; *, p < 0.05 versus CTR. au, absorbance units. asu, arbitrary scanning units.
FIGURE 5.
FIGURE 5.
Chaperones reverse LPS-induced ERS. In A and B, THP-1 cells were maintained in steady state (CTR) or treated with LPS (the two lanes in the middle) or thapsigargin (THAP). Protein extracts were submitted to immunoprecipitation (IP) with anti-TLR4 (A) or GRP78 (B) antibodies, and the resulting immunoprecipitates were separated by SDS-PAGE and blotted (IB) with anti-GRP94 (A) or TLR4 (B) antibodies. In C, THP-1 cells were maintained in steady state (CTR) or treated with LPS; protein extracts were submitted to four consecutive rounds (R1–R4) of immunoprecipitation with anti-TLR4 antibody. Immunoprecipitates collected in each round were separated by SDS-PAGE and blotted with TLR4 antibody. Membranes were stripped and reblotted with anti-GRP94 antibody. In D–F, THP-1 cells were maintained in steady state (CTR) or treated with PBA, LPS, PBA+LPS, or thapsigargin. Protein extracts were separated by SDS-PAGE and immunoblotted with anti-spliced XBP1 (D), pPERK (E), or peIF2α (F) antibodies. All membranes were stripped and reblotted with anti-β-actin. In G, the protocol for glucose deprivation followed by 24 h LPS treatment is depicted. In H–I, THP-1 cells were maintained in steady state (CTR) or treated with LPS or submitted to glucose deprivation without LPS treatment (GLU-R) or submitted to glucose deprivation followed by LPS treatment (GLU-R+LPS). Protein extracts were separated by SDS-PAGE and immunoblotted with anti-GRP94 (H) or GRP78 (I) antibodies. All membranes were stripped and reblotted with anti-β-actin. In J, THP-1 cells were maintained in steady state (CTR) or treated with LPS, compound-C (CC), CC+LPS, submitted to glucose deprivation without LPS treatment (GLU-R), submitted to glucose deprivation followed by LPS treatment (GLU-R+LPS), treated with CC followed by glucose deprivation (CC+GLU-R), or treated with CC followed by glucose deprivation and then followed by LPS (CC+GLU-R+LPS). Protein extracts were separated by SDS-PAGE and immunoblotted with antibodies against pAMPK, pACC, GRP94, GRP78, pPERK, peIF2α, spliced XBP1, or ATF6. In all experiments, n = 6. A, B, D–F, H and I: *, p < 0.05 versus CTR; H, #, p < 0.05 versus LPS. C, *, p < 0.05 versus respective round in CTR. asu, arbitrary scanning units.
FIGURE 6.
FIGURE 6.
GRP94 and GRP78 control ERS in THP-1 cells. In A–C, THP-1 cells were maintained in steady state (CTR) or treated with LPS (24 h) or submitted to glucose deprivation without LPS treatment (GLU-R) or submitted to glucose deprivation followed by LPS treatment (GLU-R+24 h LPS). Protein extracts were separated by SDS-PAGE and immunoblotted with anti-spliced XBP1 (A), peIF2α (B), or ATF6 (C) antibodies. In D and E, THP-1 cells were treated with Lipofectamine alone (Lipo) or in the presence of glucose deprivation (LipoGlu-R) or with a control siRNA (siCTR), a GRP94 (D), or a GRP78 (E) siRNA (siGRP94 or siGRP78, respectively), or a GRP94 (D) or a GRP78 (E) siRNA in the presence of glucose deprivation (siGRP94Glu-R or siGRP78Glu-R, respectively). Protein extracts were separated by SDS-PAGE and immunoblotted with anti-GRP94 (D) or GRP78 (E) antibodies. In F–L, THP-1 cells were treated with Lipofectamine alone (Lipo) or in the presence of LPS, glucose deprivation (LipoGlu-R), glucose deprivation plus LPS (GLU-R+LPS) in the absence of presence of a GRP94 (F–H and L), or a GRP78 (I–K) siRNA (siGRP94 or siGRP78, respectively). Protein extracts were separated by SDS-PAGE and immunoblotted with anti-spliced XBP1 (F and I), pPERK (G and J), or ATF6 (H and K) antibodies or real-time PCR was used to determine the expression of IL-8 (L). In A–K, all membranes were stripped and reblotted with anti-β-actin. In all experiments, n = 6. *, p < 0.05 versus CTR in A–C or versus Lipofectamine alone in D–L. In A and B, #, p < 0.05 versus 24-h LPS. asu, arbitrary scanning units.
FIGURE 7.
FIGURE 7.
Schematic representation of the effect of chaperone deficiency on the activation of UPR. Under non-stressing conditions the rate of synthesis and folding of TLR4 is perfectly matched by the availability of chaperones, particularly GRP94 (upper panel). Under long term LPS stimulus, the need for novel TLR4 protein units causes an imbalance between folding demand and chaperone availability, leading to the activation of an unfolded protein response (lower panel).

References

    1. Gregor M. F., Hotamisligil G. S. (2011) Inflammatory mechanisms in obesity. Annu Rev Immunol 29, 415–445 - PubMed
    1. Hotamisligil G. S. (2010) Endoplasmic reticulum stress and the inflammatory basis of metabolic disease. Cell 140, 900–917 - PMC - PubMed
    1. Tabas I., Tall A., Accili D. (2010) The impact of macrophage insulin resistance on advanced atherosclerotic plaque progression. Circ. Res. 106, 58–67 - PMC - PubMed
    1. Tsukumo D. M., Carvalho-Filho M. A., Carvalheira J. B., Prada P. O., Hirabara S. M., Schenka A. A., Araújo E. P., Vassallo J., Curi R., Velloso L. A., Saad M. J. (2007) Loss-of-function mutation in Toll-like receptor 4 prevents diet-induced obesity and insulin resistance. Diabetes 56, 1986–1998 - PubMed
    1. Ozcan U., Cao Q., Yilmaz E., Lee A. H., Iwakoshi N. N., Ozdelen E., Tuncman G., Görgün C., Glimcher L. H., Hotamisligil G. S. (2004) Endoplasmic reticulum stress links obesity, insulin action, and type 2 diabetes. Science 306, 457–461 - PubMed

Publication types

MeSH terms

Substances