Comparative Study
. 2012;7(3):e33297.
doi: 10.1371/journal.pone.0033297. Epub 2012 Mar 12.

Unique proteomic signatures distinguish macrophages and dendritic cells

Affiliations
Comparative Study

Unique proteomic signatures distinguish macrophages and dendritic cells

Lev Becker et al. PLoS One. 2012.

Abstract

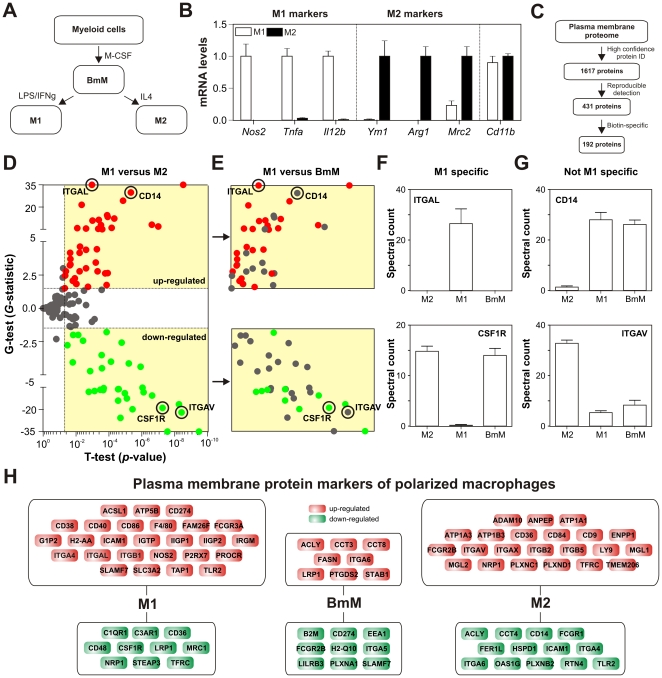
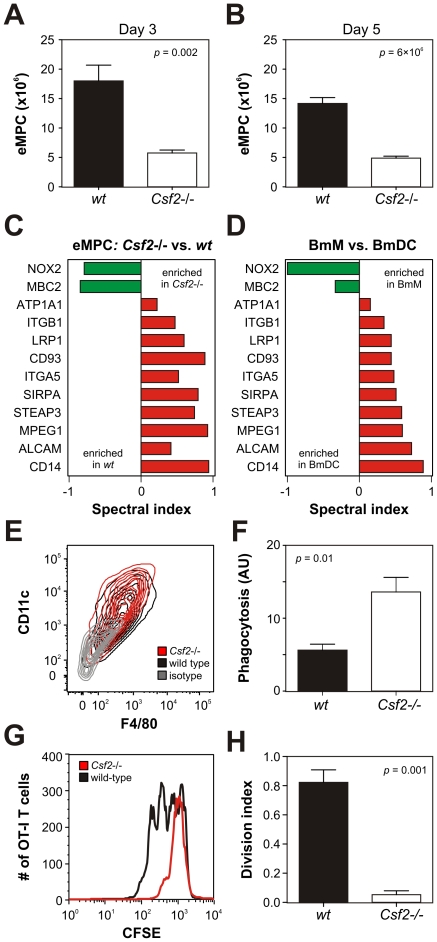
Monocytes differentiate into heterogeneous populations of tissue macrophages and dendritic cells (DCs) that regulate inflammation and immunity. Identifying specific populations of myeloid cells in vivo is problematic, however, because only a limited number of proteins have been used to assign cellular phenotype. Using mass spectrometry and bone marrow-derived cells, we provided a global view of the proteomes of M-CSF-derived macrophages, classically and alternatively activated macrophages, and GM-CSF-derived DCs. Remarkably, the expression levels of half the plasma membrane proteins differed significantly in the various populations of cells derived in vitro. Moreover, the membrane proteomes of macrophages and DCs were more distinct than those of classically and alternatively activated macrophages. Hierarchical cluster and dual statistical analyses demonstrated that each cell type exhibited a robust proteomic signature that was unique. To interrogate the phenotype of myeloid cells in vivo, we subjected elicited peritoneal macrophages harvested from wild-type and GM-CSF-deficient mice to mass spectrometric and functional analysis. Unexpectedly, we found that peritoneal macrophages exhibited many features of the DCs generated in vitro. These findings demonstrate that global analysis of the membrane proteome can help define immune cell phenotypes in vivo.


Conflict of interest statement

Competing Interests: The authors have declared that no competing interests exist.

Figures

Figure 1
Figure 1. The plasma membrane proteome of macrophages.
Panel A: Bone marrow-derived macrophages (BmM) were derived from bone marrow precursor cells of C57BL/6 mice cultured with M-CSF. Classically activated macrophages (M1) and alternatively activated macrophages (M2) were derived from BmMs by treatment with IFN-γ and LPS or with IL-4. Panel B: qRT-PCR of markers used to detect M1 and M2 macrophages. Results (means and SEMs, N = 6) were standardized to 18S, expressed relative to the cell type with the highest expression of each gene, and are representative of 3 independent analyses. Panel C: LC-ESI-MS/MS analysis of plasma membrane proteins isolated from differentially activated macrophages. Proteins were quantified by spectral counting (total number of peptides identified for a given protein) and subjected to sequential criteria to identify 192 plasma membrane proteins that were reproducibly detected with high confidence. Panel D: Quantification of the membrane proteomes of M1 and M2 macrophages. Differentially expressed proteins (red, upregulated; green, downregulated; gray, not significantly different) were identified based on t-test and G-test statistics. Significance cutoffs (dashed lines; p<0.05 and G-statistic >1.5 or <−1.5) were determined based on permutation analysis (estimated FDR<5%). Panel E: Quantification of the membrane proteomes of M1 macrophages and BmMs. Proteins differentially expressed by M1 cells relative to both BmMs and M2 cells are indicated with colored dots (red, upregulated; green, downregulated). Proteins differentially expressed by M1 and M2 cells (Panel D) but not differentially expressed by M1 and BmMs are indicated by gray dots. Panel F: Examples of proteins that distinguish M1 cells from both BmM and M2 cells (CSF1R, ITGAL). Results (N = 6 per group) are means and SDs. Panel G: Examples of proteins that fail to distinguish M1 cells from both BmM and M2 cells (CD14, ITGAV). Panel H: Plasma membrane proteins differentially expressed by M1 cells (36 proteins), M2 cells (35 proteins), and BmMs (17 proteins).
Figure 2
Figure 2. The plasma membrane proteome of bone marrow-derived dendritic cells (DCs).
Panel A: Bone marrow-derived dendritic cells (BmDCs) were obtained by culturing bone marrow cells with GM-CSF. Panel B: Flow cytometric analysis of CD11c and F4/80 expression in BmDCs and BmMs. Results are presented as a contour plot with 10% probability increments. Panel C: Cell-surface exp ression of MHC-II by BmDCs and BmMs as assessed by flow cytometry. Panel D: The plasma membrane proteome of DCs. Upper Panel: Proteins expressed at similar levels by DCs and either M1 cells, M2 cells, or BmMs. Lower Panel: Proteins differentially expressed by DCs relative to M1 cells, M2 cells, and BmMs (G-test>1.5 or <−1.5 and t-test: p<0.05). Red, upregulated; green, downregulated. Panel E: Examples of proteins expressed at similar levels by DCs and either M1 cells, or M2 cells. Results (N = 6 per group) are means and SDs. Panel F: Examples of plasma membrane proteins differentially expressed by DCs. Flow cytometry experiments are representative of 3 independent analyses.
Figure 3
Figure 3. Immunocytochemical detection of plasma membrane protein markers.
Expression levels of widely used plasma membrane protein markers (Panels A–B) and newly identified markers (Panels C–D) of M1 cells, M2 cells, BmMs, and BmDCs were assessed by mass spectrometry (Panels A,C) and immunocytochemistry (Panels B,D). For MS/MS, proteins were quantified by spectral counting and expressed relative to the cell type with the highest expression level for each protein. Results are means and SDs. Cells were stained with antibodies specific to each protein (red channel), counterstained with DAPI to visualize nuclei (blue-channel), and examined by confocal microscopy. Immunostaining and microscopy were performed on the same day with identical microscope settings. Results are representative of 3 independent analyses.
Figure 4
Figure 4. Mass spectrometric and immunohistochemical staining of thioglycolate-elicited peritoneal cells (eMPCs), polarized macrophages, and DCs.
Panels A–B: Hierarchical cluster analysis of eMPCs. Cells were harvested from the peritoneal cavity of C57BL/6J-Ldlrtm1Her mice 5 days after intraperitoneal injection with thioglycolate. Isolated plasma membrane proteins detected by LC-MS/MS analysis of eMPCs were subjected to hierarchical cluster analysis, using the 107 proteins identified as differentially expressed by myeloid cells generated in vitro ( Fig. 2 ). Panel B: Relationships among eMPCs, M1 cells, M2 cells, BmMs, and DCs, as determined by cluster analysis. Panel C: Protein expression in eMPCs, M1 cells, M2 cells, BmMs, and BmDCs. Protein levels were quantified by MS/MS and spectral counting. Data are presented as means and SDs. Panels D–E: Flow cytometric analysis of CD11b, CD11c, and F4/80 in eMPCs. Results are presented as contour plots with 10% probability increments. Panel F: qRT-PCR analysis of M1 marker genes (Nos2, Il12b, Tnfa) in M1 macrophages, BmDCs, and eMPCs. Results (means and SEMs; N = 6) were standardized to 18S levels and expressed relative to M1 macrophages. Panel G: Immunostaining of eMPCs. Cells were stained with antibodies (red channel) to plasma membrane proteins differentially expressed by BmDCs (MBC2, FER1L), BmMs (ITGA6, STAB1), M2 cells (TFRC, ITGB5), and M1 cells (CD11a, CD40). Nuclei were visualized by DAPI staining (blue channel). Immunostaining and microscopy were performed on the same day and with identical microscope settings to experiments presented in Fig. 3D and Fig. S3. Results obtained for flow cytometry, qRT-PCR, and immunocotyochemistry are representative of 3 independent analyses.
Figure 5
Figure 5. Analysis of eMPCs harvested from wild-type and GM-CSF-deficient (Csf2−/−) mice.
eMPCs isolated from wild-type (wt) and Csf2−/− mice were interrogated for cell number, function, and protein expression. Panel A–B: Accumulation of eMPCs 3 days (Panel A) and 5 days (Panel B) following intraperitoneal injection with thioglycolate. Results (N = 6) are means and SEMs. Panel C: Plasma membrane proteomic analysis of eMPCs isolated from Csf2−/− and wild-type mice. Differentially-expressed proteins were identified using the t-test and G-test (p<0.05 and G-statistic >1.5) and quantified using the spectral index. Panel D: Proteins differentially expressed by eMPCs isolated from Csf2−/− mice (see Panel C) were measured in BmMs and BmDCs and quantified using the spectral index. Panel E: Cell surface CD11c and F4/80 expression on eMPCs was assessed by flow cytometry. Results are presented as contour plots with 10% probability increments. Panel F: Phagocytosis of fluorescein-labeled E. coli by eMPCs. Results (arbitrary units, AU; N = 4) are means and SEMs. Panel G–H: Antigen cross-presentation by eMPCs. Ovalbumin (0.2 mg/mL)-treated eMPCs were incubated with CFSE-labeled spleen cells isolated from OT-I transgenic mice. Levels of CFSE were assessed in OT-I T cells selected by flow cytometry and expression levels of CD8 and Vb5 (Panel G). The division index was calculated using FlowJo software. Results (N = 4) are means and SEMs (Panel H). Where applicable, p-values were derived using a two-tailed Student's t-test. Results obtained for eMPC quantification, flow cytometry, phagocytosis and antigen cross-presentation are representative of 3 independent analyses.
Figure 6
Figure 6. Plasma membrane protein signatures of myeloid cells identify unique cell functions.
Gene ontology analysis of plasma membrane proteins enriched in M1 macrophages, M2 macrophages, all macrophage types (BmM, M1, and M2), and BmDCs identifies functional categories of proteins enriched in each cell type (p<0.05 with Benjamini-Hochberg correction). The top three functional annotations are presented for each cell type along with three representative proteins.

References

    1. Bogdan C, Nathan C. Modulation of macrophage function by transforming growth factor beta, interleukin-4, and interleukin-10. Ann N Y Acad Sci. 1993;685:713–739. - PubMed
    1. Gordon S, Taylor PR. Monocyte and macrophage heterogeneity. Nat Rev Immunol. 2005;5:953–964. - PubMed
    1. Hamilton JA. Colony-stimulating factors in inflammation and autoimmunity. Nat Rev Immunol. 2008;8:533–544. - PubMed
    1. Hargreaves DC, Horng T, Medzhitov R. Control of inducible gene expression by signal-dependent transcriptional elongation. Cell. 2009;138:129–145. - PMC - PubMed
    1. Gordon S, Martinez FO. Alternative activation of macrophages: mechanism and functions. Immunity. 2010;32:593–604. - PubMed

Publication types