

Causal diagrams in systems epidemiology
- PMID: 22429606
- PMCID: PMC3382427
- DOI: 10.1186/1742-7622-9-1
Causal diagrams in systems epidemiology
Abstract
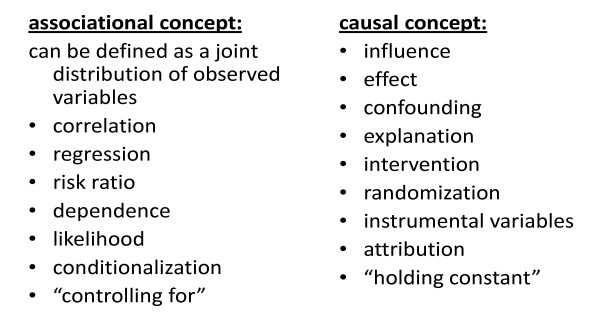
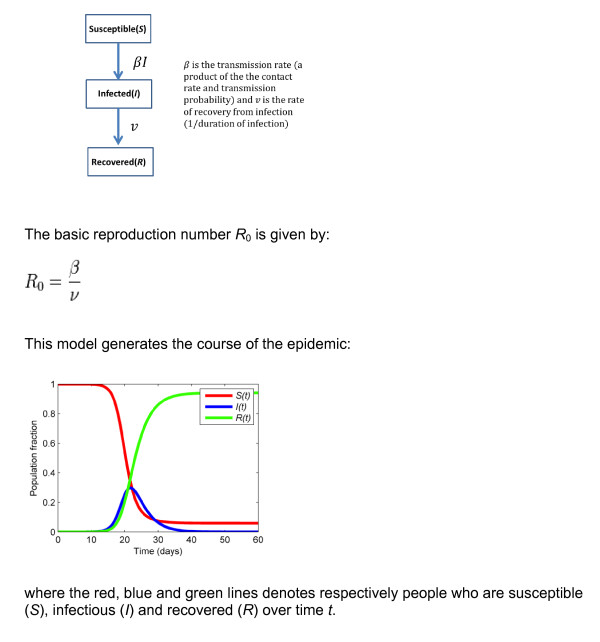
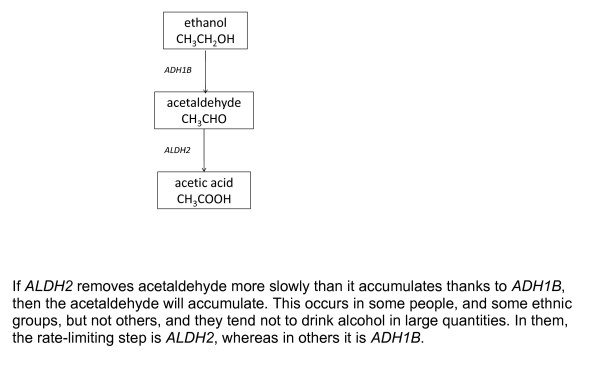
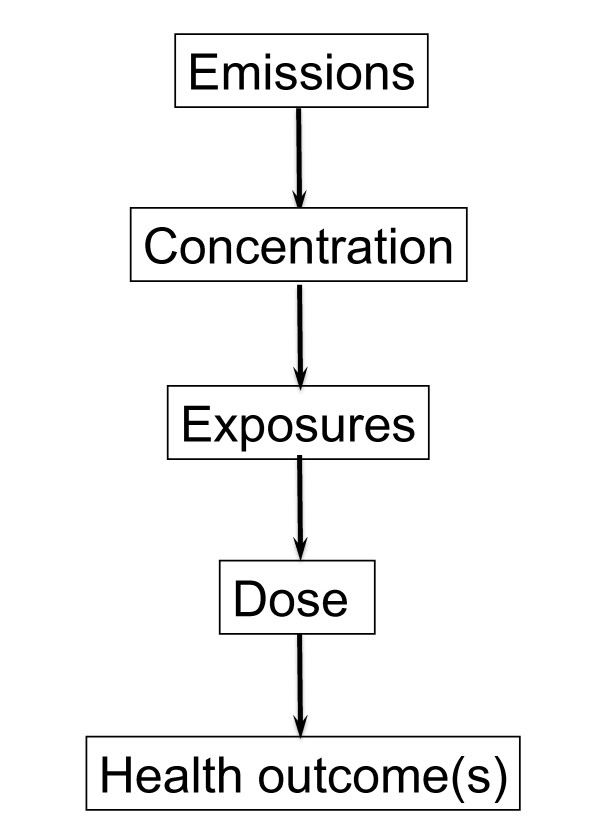
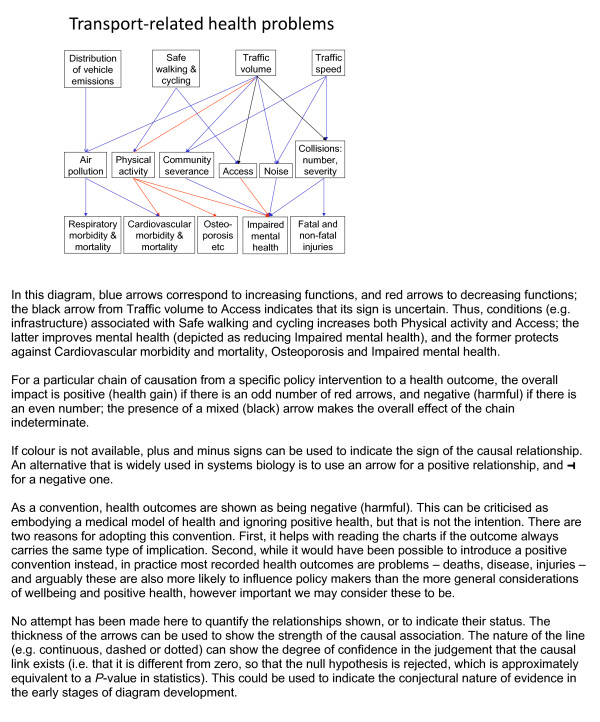
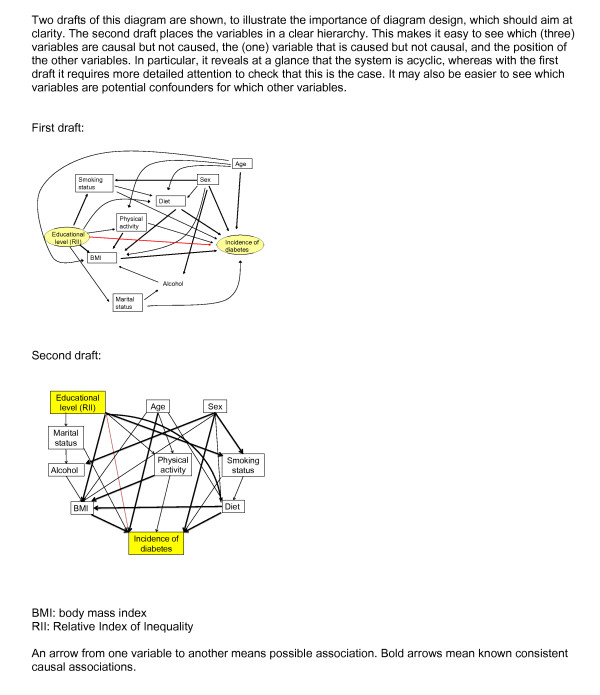
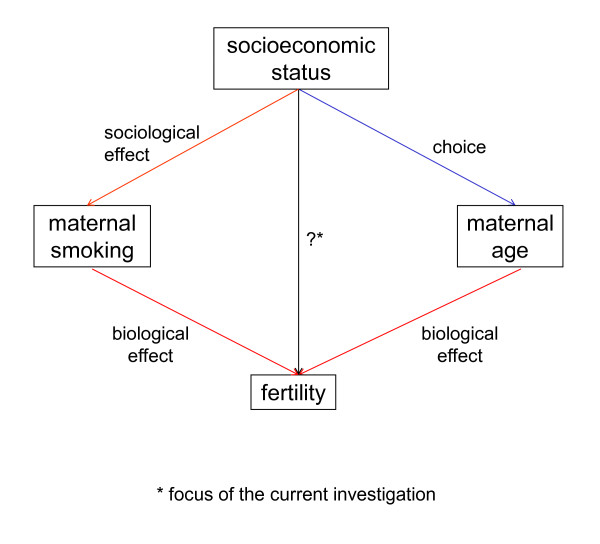
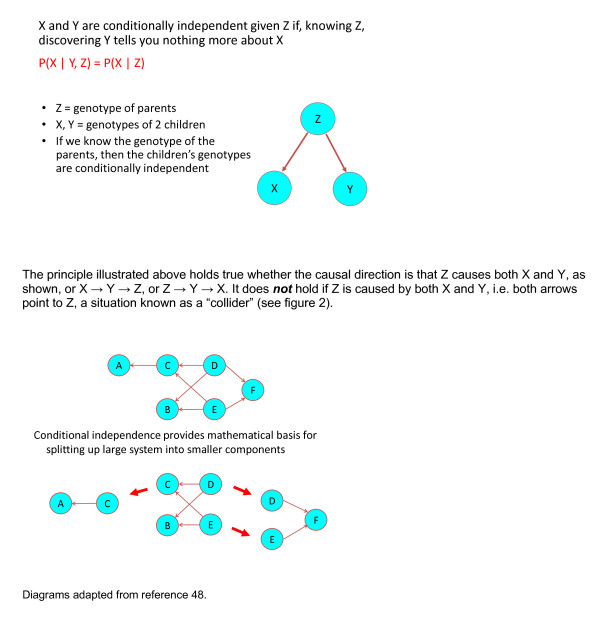
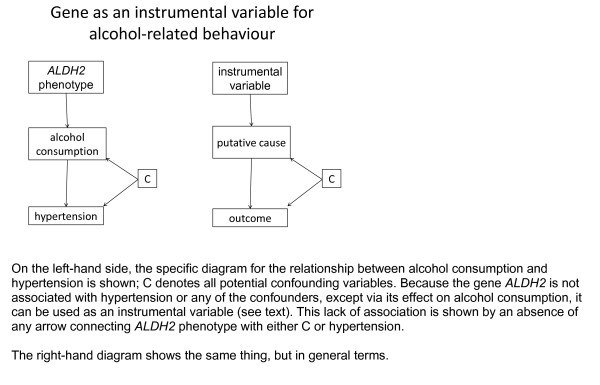
Methods of diagrammatic modelling have been greatly developed in the past two decades. Outside the context of infectious diseases, systematic use of diagrams in epidemiology has been mainly confined to the analysis of a single link: that between a disease outcome and its proximal determinant(s). Transmitted causes ("causes of causes") tend not to be systematically analysed.The infectious disease epidemiology modelling tradition models the human population in its environment, typically with the exposure-health relationship and the determinants of exposure being considered at individual and group/ecological levels, respectively. Some properties of the resulting systems are quite general, and are seen in unrelated contexts such as biochemical pathways. Confining analysis to a single link misses the opportunity to discover such properties.The structure of a causal diagram is derived from knowledge about how the world works, as well as from statistical evidence. A single diagram can be used to characterise a whole research area, not just a single analysis - although this depends on the degree of consistency of the causal relationships between different populations - and can therefore be used to integrate multiple datasets.Additional advantages of system-wide models include: the use of instrumental variables - now emerging as an important technique in epidemiology in the context of mendelian randomisation, but under-used in the exploitation of "natural experiments"; the explicit use of change models, which have advantages with respect to inferring causation; and in the detection and elucidation of feedback.
Figures

References
-
- Epstein P. Changing planet, changing health. University of California Press; 2011.
-
- Pearl J. Causality: models, reasoning and inference. New York: Cambridge University Press; 2000.
-
- Pearl J. Causal inference in the health sciences: a conceptual introduction. Health services and outcomes research methodology. 2002;2:189–220.
-
- Joffe M. In: Explanation, Prediction, and Confirmation. New Trends and Old Ones Reconsidered. Dieks D, Wenceslao JG, Hartmann S, Uebel T, Weber M, editor. Springer; 2011. Causality and evidence discovery in epidemiology.
LinkOut - more resources
Full Text Sources
Other Literature Sources
Miscellaneous
