. 2012 Jun;142(7):1516-25.e3.
doi: 10.1053/j.gastro.2012.02.039. Epub 2012 Mar 16.

Binding of hepatitis A virus to its cellular receptor 1 inhibits T-regulatory cell functions in humans

Affiliations

Binding of hepatitis A virus to its cellular receptor 1 inhibits T-regulatory cell functions in humans

Mohanraj Manangeeswaran et al. Gastroenterology. 2012 Jun.

Abstract

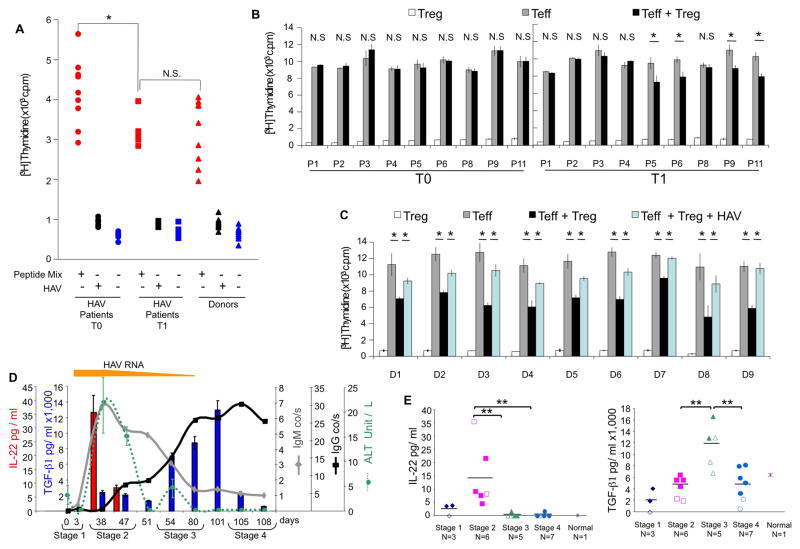
Background & aims: CD4+ T-regulatory (Treg) cells suppress immune responses and control self-tolerance and immunity to pathogens, cancer, and alloantigens. Most pathogens activate Treg cells to minimize immune-mediated tissue damage and prevent clearance, which promotes chronic infections. However, hepatitis A virus (HAV) temporarily inhibits Treg-cell functions. We investigated whether the interaction of HAV with its cellular receptor 1 (HAVCR1), a T-cell co-stimulatory molecule, inhibits the function of Treg cells to control HAV infection.

Methods: We studied the effects of HAV interaction with HAVCR1 on human T cells using binding, signal transduction, apoptosis, activation, suppression, cytokine production, and confocal microscopy analyses. Cytokines were analyzed in sera from 14 patients with HAV infection using bead arrays.

Results: Human Treg cells constitutively express HAVCR1. Binding of HAV to HAVCR1 blocked phosphorylation of Akt, prevented activation of the T-cell receptor, and inhibited function of Treg cells. At the peak viremia, patients with acute HAV infection had no Treg-cell suppression function, produced low levels of transforming growth factor-β , which limited leukocyte recruitment and survival, and produced high levels of interleukin-22, which prevented liver damage.

Conclusions: Interaction between HAV and its receptor HAVCR1 inhibits Treg-cell function, resulting in an immune imbalance that allows viral expansion with limited hepatocellular damage during early stages of infection-a characteristic of HAV pathogenesis. The mechanism by which HAV is cleared in the absence of Treg-cell function could be used as a model to develop anticancer therapies, modulate autoimmune and allergic responses, and prevent transplant rejection.


Conflict of interest statement

Disclosures: The authors have declared that no conflict of interest exists. The findings and conclusions in this article have not been formally disseminated by the FDA and should not be construed to represent any FDA determination or policy.

Figures

Figure 1
Figure 1. HAV blocks binding of apoptotic cells to HAVCR1
(A)HAVCR1- or Vector-HEK293 cells stained with PE-labeled anti-HAVCR1 mAb (blue) or isotype (grey) and analyzed by flow cytometry. (B) Apoptotic Jurkat cells stained with CMFDA (Jurkat-CMFDA, green) were bound to Vector- and HAVCR1-HEK293 cell monolayers pretreated with anti-FLAG mAb or anti-HAVCR1 mAb 3D1. Monolayers analyzed by epifluorescence and micrographs taken with a Zeiss Axioscope inverted microscope at 200 X using FITC filters. (C) Binding of apoptotic Jurkat-CMFDA cells to HAVCR1-HEK293 cell monolayers treated with uninfected cell extracts or different amounts of HAV. Monolayers analyzed and micrographs taken as in (B). (D) Apoptotic Jurkat-CMFDA cells bound to HAVCR1- or mHavcr1-HEK293 cell monolayers treated with uninfected cell extracts or HAV. Fluorescence associated with the cell monolayers determined in a plate reader. (E) Binding of HAV to HAVCR1-, mHavcr1-, and Vector-HEK293 cells determined by qRT-PCR. (F) Space-filling model of the IgV domain of HAVCR1 based on the crystal structure of mHavcr1 (PDB 2OR8) showing the location of W92, F93, and N94 residues in the FG-loop and A21, D62 and R65 residues in the BED face (left panel). Soluble-receptor neutralization assay using monkey HAVCR1-Fc (mkHAVCR1-Fc) W92A, F93A, and W92A-F93A, and N94A mutants (right panel). Wild type mkHAVCR1-Fc and poliovirus receptor (PVR-Fc) were used as controls. Values in graphs represent means ± s.d., data representative of 3 different experiments, n=3 (D,E) and n=8 (F). *, P =0.001; **, P <0.0001.
Figure 2
Figure 2. HAV blocks HAVCR1 signaling
(A) Kinetics of Akt phosphorylation at Ser473 in extracts of HAVCR1- and Vector-Jurkat cells activated with apoptotic cells determined using phospho-specific antibodies by xMAP Luminex technology. (B) Akt phosphorylation at Ser473 as in (A) but cells treated or not with anti-HAVCR1 mAb 3D1 and activated or not with apoptotic cells for 30 min. (C) Same as (B) but cells pretreated with cell extracts of uninfected cells or HAV and activated with apoptotic cells for 30 min. (D) Same as (A) but HAVCR1-Jurkat cells pretreated with cell extracts of uninfected cells or HAV. (E) HAVCR1- and Vector Jurkat cells treated with medium (grey), 100 ng/ml FasL (green), or FasL plus HAV (red) for 16 h at 37°C, stained with LIVE/DEAD Aqua fluorescent reactive dye that binds preferentially to dead cells, and analyzed by flow cytometry. (F)Protection against HAV infection by anti-HAVCR1 mAb 1D12. Antibody protection assay , in African green monkey kidney cells treated or not with 50 μg/ml anti-HAVCR1 mAb 1D12 and infected with HAV or mock-infected for 3 days, fixed, and stained with human anti-HAV and FITC-labeled anti-human antibodies. Micrographs taken as in Figure 1B. The mean fluorescence intensity (MFI) values are means ± s.d. after normalization by total GAPDH, n=3, data representative of 3 different experiments. *, P <0.001.
Figure 3
Figure 3. Binding of HAV to HAVCR1 blocks TCR activation
(A) Phosphorylation of ZAP-70 determined by multiplex phospho-specific immunoarray assay using xMAP Luminex technology in cell lysates of HAVCR1- and Vector-Jurkat cells treated or not with anti-HAVCR1 mAb 1D12, followed by HAV or uninfected cell extracts, and finally anti-CD3/CD28 beads. (B) Same as (A) but for the detection of activated LAT. (C)Phospho-specific immunoarray assay as (A and B) for the detection of activated ZAP-70 and LAT in cell lysates of HAVCR1-Jurkat cells treated first with anti-CD3/CD28 beads and then with HAV or uninfected cell extracts. (D) Jurkat cells cotransfected with plasmids coding for HAVCR1, HAVCR1 Y350A, or vector and an AP-1 luciferase reporter were treated as in (A,B). Luciferase in cell extracts measured as Relative Light Units (RLU). (E) Jurkat cells cotransfected and analyzed as in (D) but with a plasmid coding for NFAT/AP-1 luciferase reporter instead of AP-1 reporter. (F) Fluorescence confocal microscopy analysis of HAVCR1-jurkat cells treated with HAV, activated with anti-CD3 mAb, and stained with biotin-labeled anti-HAVCR1 Ab 1750, Alexa Fluor 594-labeled streptavidin, and Alexa Fluor 488-labeled anti-CD3 mAb. Micrographs taken at 630 X with an oil immersion objective are representative of two experiments. Values in graphs represent means ± s.d. after normalization by total GAPDH (A,B) or protein content (D,E), n=3, data representative of 3 different experiments. *, P <0.01; **, P <0.001.
Figure 4
Figure 4. Human Treg express HAVCR1
(A) Purified CD4+CD25− and CD4+CD25+ human T-cells stained with anti-CD4-AmCyan and anti-CD25-PE mAbs and analyzed by flow cytometry. (B) CD4+CD25+ cells from (A) stained with anti-FoxP3-APC (purple) and anti-HAVCR1-1750-PE (blue line) mAbs or corresponding isotype controls (grey fills) and analyzed by flow cytometry. (C) Purified CD4+CD25− and CD4+CD25+ human T-cells from a different donor stained with anti-CD4-AmCyan, anti-CD25-PE, anti-HAVCR1-1D12-APC-Cy7, and anti-FoxP3-APC mAbs and analyzed by flow cytometry. (D) Analysis in the APC-Cy7 and APC channels from (C). (E) qRT-PCR analysis of the expression level of HAVCR1 mRNA in purified CD4+CD25− and CD4+CD25+ cells relative to GAPDH mRNA. The mRNA content was calculated according to the 2−ΔΔCt method and expressed in arbitrary units. Data are representative of 3 donors. Values represent means ± s.d., n=3. *, P <0.001.
Figure 5
Figure 5. Binding of HAV to HAVCR1 blocks Treg-function in T-cells from blood donors
(A) Purified CD4+CD25- (Teff) or CD4+CD25+ (Treg) T-cells from donors treated or not with HAV or cell extracts of uninfected cells and activated with anti-CD3/CD28 beads. Teff co-cultured with Treg pre-treated with HAV or uninfected cell extracts in the presence of anti-HAVCR1 1D12 mAb or control anti-FLAG mAb and activated with anti-CD3/CD28 beads. Proliferation assessed by 3H-thymidine incorporation in T-cells. (B) TGF-β1 and IL-10 concentration in Teff and Treg co-cultivation supernatants in the presence of uninfected cell extracts or HAV as assessed by xMAP Luminex technology. (C) Purifed Treg were treated or not with anti-CD3/CD28 activating beads, anti-HAVCR1 mAb 1D12, and HAV or uninfected cell extracts. Phosphorylation of ZAP-70 and Akt in cell lysates determined as in Figure 3A,B. (D) Donor PBMC, CD25-depleted PBMC, CD25-depeleted PBMC co-cultivated with purified autologous CD4+CD25+ Treg treated with HAV or cell extracts from uninfected cells were activated with PepMix or not activated (Medium). Proliferation assessed by 3H-thymidine incorporation in cells. Data representative of 5 (A) or 2 (B and D) different donors. Values in graphs represent means ± s.d., n=3. *, P <0.01.
Figure 6
Figure 6. Treg-function and cytokine production during the course of acute HAV infection
(A) proliferation of PBMC from nine HAV patients collected at T0 and T1 and nine blood donors treated or not with 0.5 mg/ml of PepMix CEFT or HAV. (B) Suppression assay using purified CD4+CD25+ Treg, CD4+CD25− Teff, or co-culture of Treg and Teff at a 1/20 ratio from nine HAV patients at T0 or T1 and activated with anti-CD3/CD28 beads. (C) Suppression assay as (B) but Treg and Teff purified from blood donors. (D) Analysis of serial plasma samples taken from a patient with acute HAV infection at different days postinfection. Concentration of IL-22 (red bars) and TGF-β1 (blue bars) determined by xMAP Luminex technology and alanine transaminase (ALT) concentration determined enzymatically (green line). Presence of HAV RNA by RT-PCR (UltraQual, NGI) and levels of anti-HAV IgM (HAVAB M, Abbott Labs) and IgG (HAVAB, Abbott Labs) levels (co/s, cut-off to signal ratio) determined at SeraCare, Inc. Samples were classified into 4 stages according to HAV RNA, IgM, and IgG levels. (E) TGF-β1 and IL-22 concentrations measured in plasma samples as in (D). Cytokine concentrations in plasma samples from a normal individual (X), thirteen HAV patients (closed symbols), and samples from the patient in (D) (open symbols) were included in the analysis. N is the number of samples per stage. Data is representative of 3 experiments (D and E). Proliferation assessed by 3H-thymidine incorporation in T-cells (A–C). Values in graphs represent means ± s.d., n=3 (B–D). Values are readings in each sample (A and E) and are representative of 3 experiments. *, P <0.05; **, P <0.01. N.S., not significant.

References

    1. Belkaid Y, Tarbell K. Regulatory T cells in the control of host-microorganism interactions (*) Annu Rev Immunol. 2009;27:551–89. - PubMed
    1. Martin A, Lemon SM. Hepatitis A virus: from discovery to vaccines. Hepatology. 2006;43:S164–72. - PubMed
    1. Perrella A, Vitiello L, Atripaldi L, Sbreglia C, Grattacaso S, Bellopede P, Patarino T, Morelli G, Altamura S, Racioppi L, Perrella O. Impaired function of CD4+/CD25+ T regulatory lymphocytes characterizes the self-limited hepatitis A virus infection. J Gastroenterol Hepatol. 2008;23:e105–10. - PubMed
    1. Berlin T, Zandman-Goddard G, Blank M, Matthias T, Pfeiffer S, Weis I, Toubi E, Singh S, Asherson R, Fraser A, Gilburd B, Sapir T, Levy Y, Lukac J, Rozman B, Kveder T, Shoenfeld Y. Autoantibodies in nonautoimmune individuals during infections. Ann N Y Acad Sci. 2007;1108:584–93. - PubMed
    1. Moon HW, Noh JK, Hur M, Yun YM, Lee CH, Kwon SY. High prevalence of autoantibodies in hepatitis A infection: the impact on laboratory profiles. J Clin Pathol. 2009;62:786–8. - PubMed

Publication types

MeSH terms