. 2012 Oct 1;520(14):3217-35.
doi: 10.1002/cne.23093.

Postnatal development of chorda tympani axons in the rat nucleus of the solitary tract

Affiliations

Postnatal development of chorda tympani axons in the rat nucleus of the solitary tract

Siting Wang et al. J Comp Neurol. .

Abstract

The chorda tympani nerve (CT), one of three nerves that convey gustatory information to the nucleus of the solitary tract (NTS), displays terminal field reorganization after postnatal day 15 in the rat. Aiming to gain insight into mechanisms of this phenomenon, CT axon projection field and terminal morphology in NTS subdivisions were examined using tract tracing, light microscopy, and immunoelectron microscopy at four postnatal ages: P15, P25, P35, and adult. The CT axons that innervated NTS rostrolateral subdivision both in the adult and in P15 rats were morphologically distinct from those that innervated the rostrocentral, gustatory subdivision. In both subdivisions, CT terminals reached morphological maturity before P15. Rostrolateral, but not rostrocentral axons, went through substantial axonal branch elimination after P15. Rostrocentral CT synapses, however, redistribute onto postsynaptic targets in the following weeks. CT terminal preference for GABAergic postsynaptic targets was drastically reduced after P15. Furthermore, CT synapses became a smaller component of the total synaptic input to the rostrocentral NTS after P35. The results underlined that CT axons in rostrocentral and rostrolateral subdivisions represent two distinct populations of CT input, displaying different morphological properties and structural reorganization mechanisms during postnatal development.


Figures

Figure 1
Figure 1
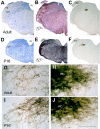
Identification of NTS, its subdivisions and CT projection fields in an adult (A-C, G-H) and a P16 (D-F, I-J ) brain. Adjacent coronal sections through rostral NTS, stained for Nissl (A, D), myelin (B, E), or ABC-DAB for tract-tracer in CT fibers (C, F). NTS and subdivision borders (insets in B and E) were identified on myelin and Nissl sections, and transposed on adjacent tracer labeled sections. G-H and I-J: Higher magnification views of CT labeled sections in C (adult) and F (P16). DAB labeled, fine CT fibers densely filled the rostrocentral subdivision (H and J), while thicker yet sparser fibers were noted in the rostrolateral (G and I) subdivision at both ages. RC: rostrocentral; RL: rostrolateral; V: ventral subdivision. 4V: fourth ventricle; sp5: spinal trigeminal tract; icp: inferior cerebellar peduncle. dcn: dorsal cochlear nucleus. Scale bar in C= 1000μm (applies to A-F); scale bar in J= 125μm (applies to G-J).
Figure 2
Figure 2
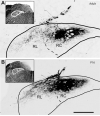
The distribution of CT terminal field in the rostral portions of the NTS at adulthood (A) compared with p16 (B). Both sections were located about 450μm posterior to the rostral pole of the NTS. The subdivision borders are identified on adjacent Nissl and myelin-stained (insets in both panels display myelin-stained sections with outlines) sections and superposed on the anterograde DAB labeled sections. The spread of CT labeling in the p16 animal is very similar to that of the adult. In both ages, the densest terminal field is found in the rostrocentral (RC) while sparser labeling in the rostrolateral subdivision (RL) covers the dorsal half and extends to the lateral NTS border. However, the qualitative density of the fiber populations is quite different. The terminal field in the rostrolateral subdivision is much denser at p16 than in the adult. At this level, the solitary tract appears as sparse yet thick bundles of axons coursing anterior to posterior direction through the labeled fields in rostrocentral subdivision (marked with an *). Scale bar=250μm.
Figure 3
Figure 3
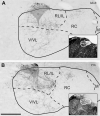
The distribution of CT terminal field in the intermediate portions of the NTS at adulthood (A) compared with p16 (B). The subdivision borders (dashed lines) and an envelope of solitary tract (shaded gray) are identified on adjacent Nissl- and myelin-stained (insets in both panels) sections and superposed on the anterograde DAB labeled sections. Both sections were located just anterior to the NTS-4th ventricle junction, the operatively defined transition region between rostrocentral subdivision and caudal NTS, and between ventral and ventrolateral subdivisions (V/VL). CT axons are present sparsely in all compartments. As with rostral sections, terminal field labeling appears qualitatively denser in the p16 than the adult NTS, while subdivisional distribution of label in the NTS appears the same. The intermediate-lateral (IL) subdivision, which is defined by lack of CT innervation in adult brains, is also devoid of fibers at P16. Scale bar=250μm.
Figure 4
Figure 4
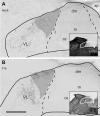
The distribution of CT terminal field in the caudal portions of the NTS at adulthood (A) compared with p16 (B). The subdivision borders (dashed lines) are identified on adjacent Nissl and Myelin sections, and they were superposed on the anterograde DAB labeled sections. Both sections were located at levels where the NTS borders the anterior-most portion of area postrema (i.e., AP=0). Sparse terminal field is found only in the ventrolateral subdivision (VL). Labeled fibers, which do not bear any swellings (i.e., axons of passage), course through the solitary tract (shaded gray). Subnuclei in caudal NTS are identified based on terminology and criteria defined in Herbert et al., 1990. As with rostral and intermediate sections, terminal field labeling appears qualitatively denser in the p16 and adult animal, while distribution pattern of label in NTS subdivisions is similar. Scale bar=250μm. Abbreviations: ce = central nucleus; pc = parvicellular nucleus; m = medial nucleus; dm = dorsomedial nucleus; I = intermediate nucleus; ap=area postrema.
Figure 5
Figure 5
Illustration of anterior-posterior size of NTS and CT labeling by subdivision from the rostral pole to Area Postrema landmark (AP0; the anterior-most coronal section that Area Postrema is present) in each of 5 P15 and 3 adult animals. The anterior-most section that NTS lined the 4th ventricle marked with dashed lines for each brain; this landmark is conventionally designated as the arbitrary border of rostral and caudal NTS. Open bars indicate the expanse of NTS from AP0 to the rostral pole. Filled bars superposed on open bars illustrate the expanse of CT labeling found in NTS subdivisions identified in adjacent Nissl/myelin reference sections. Black bar denotes CT label in the rostrocentral subdivision; dark gray bar in the rostrolateral subdivision, and light gray bar in the ventrolateral subdivisions. Because the caudal pole of NTS could not be identified in our material, the extension of NTS posterior to AP0 is not illustrated, however all sections that displayed CT label in ventrolateral subdivisions are included. The NTS in all adult brains was significantly larger than in P15 brains. While CT label in rostrocentral subdivision did not differ between p15 and adult, more sections contained CT terminal field in the rostrolateral subdivision in P15 than in adult.
Figure 6
Figure 6
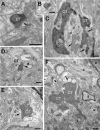
Electron microscope images of CT terminals from rostrocentral NTS, in adult (A-C), and P15 (D-F) brains. Qualitatively and quantitatively, CT terminals in P15 are indistinguishable from those in adult. A. High magnification view of a small CT labeled terminal forming a synapse with thick postsynaptic density. At both ages, terminals with a wide range of cross-section areas, including small en passant terminals (B and D) and large terminal boutons (C, E-F), which may contain unlabeled inclusions (p) protruding from postsynaptic dendrites (d). Arrows point to asymmetric synapses formed by labeled CT terminals (CT); arrowheads point to other sample synapses within the same field formed by unlabeled terminals (t). Myelinated axons (a) were encountered within the same region; no instances of label containing myelinated axon was encountered in rostrocentral NTS Scale bars = 0.5μm in all panels.
Figure 7
Figure 7
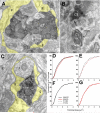
A. A large rostrolateral CT terminal (CT) is located in a glomerulus, ensheathed in glial processes (tinted yellow). This glomerulus also contains other dendrites and axons, which are unlabeled. B. Rostrolateral CT terminal field often contained labeled myelinated (mye) axon segments (Ct ax). C. A labeled CT axon forms a synaptic contact with another vesicle filled profile (t); these two profiles are ensheathed with glial processes (tinted yellow), suggesting that the synapse is part of a glomerulus. Images in A-C are obtained within rostrolateral subdivision of an adult brain. D-G: Terminal cross-section area comparisons of CT terminal populations sampled in rostrocentral subdivision (RC) in the adult (black solid line), in rostrolateral subdivision (RL) in the adult (red solid line), rostrocentral subdivision in P15 (black dashed line) and rostrolateral subdivision in P15 (red dashed line). Pairs in panels D and E were statistically different from each other.
Figure 8
Figure 8
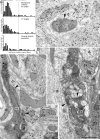
A-B: Method for quantifying CT axon areal density. A. Low magnification electron micrograph example of CT terminal field. Scale bar = 1μm. B. To calculate total area of neuropil analyzed, the image area was measured, excluding the areas of somata (soma) and myelinated axons (ma; excluded areas are shaded gray). All labeled profiles are outlined, and the ones that form a synapse (*, also in C) are identified. All outlines are used in computation of Cmax and Cmin (feret-max and feret-min functions of Image ProPlus; dashed lines at two representative outline). C. High magnification view of the synapse-forming terminal from A (tCT). Arrowhead points to the CT synapse. Arrows point to synapses from unlabeled terminals D. High magnification of representative cross-section of CT fibers (CT) that do not bear a synapse at the current level of section. Unlabeled vesicle containing profiles (t) in proximity are marked for comparison. d=dendrite; m=mitochondria. E. The frequency of synapses formed along the CT axon (number of synapses/total length of labeled fiber observed). F. Volumetric synapse density of the CT terminals. G. Volumetric synapse density of all synapses in the same region. H. Percent ratio of CT volumetric density to total volumetric density in the rostrocentral subdivision. Error bars indicate the standard error of mean; *=p<0.05, **=p<0.01.
Figure 9
Figure 9
A. Top panel: Frequency distribution of gold densities measured in DAB–negative terminals displaying asymmetric synapses in a representative brain. The 95th percentile value was deemed the criterion gold density for GABA positivity, and applied to the gold densities measured in profiles postsynaptic to CT labeled terminals (middle panel). The criterion gold density (vertical gray line) also divided a general dendrite population measured within the same section (bottom panel) as GABA+ and GABA- groups. B. A CT terminal (CT) from and adult brain forms an asymmetric synapse (large arrowhead) onto a GABA- dendrite (d-). Compare the gold density within the postsynaptic dendrite with that in surrounding terminals (t+; thin arrow points to a symmetrical synapse in one) and a dendrite (d+), which contained above-criterion gold density. C. A CT terminal forms two synapses (arrowheads): one onto a GABA- dendrite (d-) and another onto a GABA+ profile that contained vesicles (d/t+). D. A CT terminal at P15, bearing unlabeled inclusions, forms two synapses (arrowheads) onto a large caliber GABA- dendrite, and a GABA- inclusion. A GABA+ terminal (t+) and a GABA+ dendrite (d+) are also present in the same field. Scale bar=0.5μm.

Similar articles

Cited by

References

    1. Bao H, Bradley RM, Mistretta CM. Development of intrinsic electrophysiological properties in neurons from the gustatory region of rat nucleus of solitary tract. Brain Res Dev Brain Res. 1995;86(1-2):143–154. - PubMed
    1. Bickford ME, Gunluk AE, Van Horn SC, Sherman SM. GABAergic projection from the basal forebrain to the visual sector of the thalamic reticular nucleus in the cat. J Comp Neurol. 1994;348(4):481–510. - PubMed
    1. Bickford ME, Slusarczyk A, Dilger EK, Krahe TE, Kucuk C, Guido W. Synaptic development of the mouse dorsal lateral geniculate nucleus. J Comp Neurol. 2010;518(5):622–635. - PMC - PubMed
    1. Biedenbach MA, Chan KY. Tongue mechanoreceptors: comparison of afferent fibers in the lingual nerve and chorda tympani. Brain research. 1971;35(2):584–588. - PubMed
    1. Brown M, Renehan WE, Schweitzer L. Changes in GABA-immunoreactivity during development of the rostral subdivision of the nucleus of the solitary tract. Neuroscience. 2000;100(4):849–859. - PubMed

Publication types

MeSH terms

Substances