

doi: 10.1101/gad.186411.111.
Epub 2012 Mar 19.
A key role for EZH2 and associated genes in mouse and human adult T-cell acute leukemia
Affiliations
- PMID: 22431509
- PMCID: PMC3323876
- DOI: 10.1101/gad.186411.111
Item in Clipboard
A key role for EZH2 and associated genes in mouse and human adult T-cell acute leukemia
Genes Dev.
.
Abstract
In this study, we show the high frequency of spontaneous γδ T-cell leukemia (T-ALL) occurrence in mice with biallelic deletion of enhancer of zeste homolog 2 (Ezh2). Tumor cells show little residual H3K27 trimethylation marks compared with controls. EZH2 is a component of the PRC2 Polycomb group protein complex, which is associated with DNA methyltransferases. Using next-generation sequencing, we identify alteration in gene expression levels of EZH2 and acquired mutations in PRC2-associated genes (DNMT3A and JARID2) in human adult T-ALL. Together, these studies document that deregulation of EZH2 and associated genes leads to the development of mouse, and likely human, T-ALL.
Figures
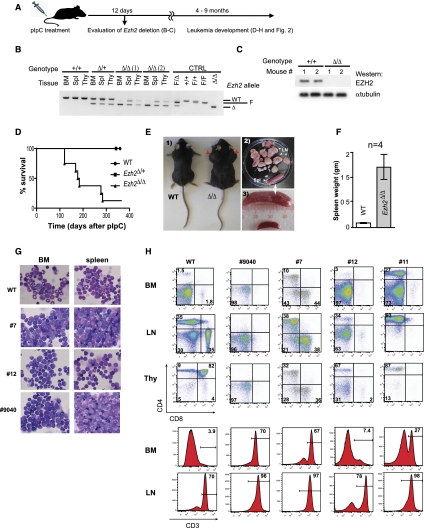
Leukemia development in Ezh2-deficient mice. (A) Outline of the experimental approach. (B) PCR-based analysis of Ezh2 deletion in hemopoietic tissues at 12 d after pIpC treatment. Primer pairs (sequence available on request) amplify a 314-base-pair (bp) wild-type (WT) Ezh2 fragment, a 280-bp fragment identifying the conditional Ezh2F allele, and a 200-bp fragment of the excised Ezh2Δ allele. Tail clippings were used as a source of control DNA. (C) Western blot analysis of EZH2 levels in bone marrow cells of wild-type and Ezh2F/Δ mice 12 d after pIpC treatment. α-Tubulin levels are shown as a loading control. (D) Kaplan-Meier survival plot of pIpC-treated wild-type, Ezh2F/+, and Ezh2F/Δ mice. The day of the last pIpC injection was designated as day 0 of the experiment. (E, panel 1) Photograph of a representative sick Ezh2F/Δ mouse showing enlarged lymph nodes (red arrows). Note also a bloated appearance, suggesting the presence of an abdominal mass. An age-matched mouse from the control wild-type cohort is shown for comparison. (Panel 2) Lymph nodes and spleen of an Ezh2F/Δ mouse shown in panel 1. A wild-type spleen is shown for comparison in panel 3. (F) Splenomegaly of the sick Ezh2F/Δ mice. Result shown represents mean spleen weight ± SD; n = 4. (G) Wright stain-dyed cytospin preparations of bone marrow and spleen cells from a sick Ezh2F/Δ mouse; 40-fold magnification. Mouse identification numbers are shown at the left. (H) Phenotypical characterization of Ezh2F/Δ leukemias. (Top panels) Proportions of CD4+ and CD8+ cells. (Bottom panels) Proportions of CD3+ cells in the bone marrow and lymph nodes. Mouse identification numbers are shown at the top, and tissues analyzed are indicated at the left. (BM) Bone marrow; (LN) lymph node; (Thy) thymus.
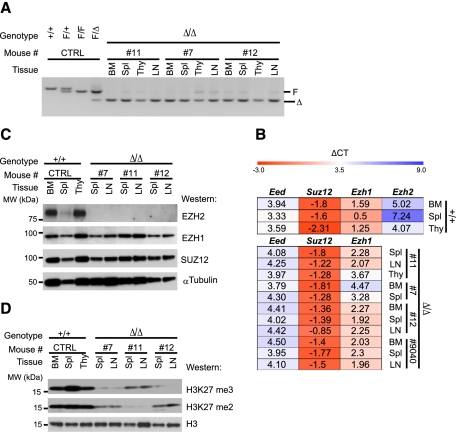
Genetic and biochemical characterizations of Ezh2Δ/Δ leukemias. (A) PCR-based analysis of Ezh2 deletion in leukemic cell populations. Mouse identification numbers are shown at the top, and the positions of the conditional (F) and deleted (Δ) Ezh2 alleles are shown at the right. Controls were as described for Figure 1A. (B) Heat map showing expression of PRC2 transcripts in hemopoietic tissues of wild-type (WT) controls. Expression values of genes were normalized relative to endogenous HPRT (hypoxanthine-guanine phosphoribosyltransferase) controls. (Top panel) Wild-type controls. (Bottom panel) Ezh2Δ/Δ leukemias. Transcripts are shown at the top, and mouse identification numbers and tissues analyzed are shown at the right. Red and blue represent high and low expression levels, respectively. (C) Western blot analysis of PRC2 protein levels in hemopoietic tissues of sick Ezh2Δ/Δ mice. α-Tubulin levels are shown as a loading control. Mouse identification numbers and tissues analyzed are shown at the top, the blotting antibodies are identified at the right, and the positions of molecular weight markers are indicated at the left. (D) Western blot analysis of global H3K27me2/3 levels. Histone H3 levels are shown as loading controls. Blot labels are as described for C.
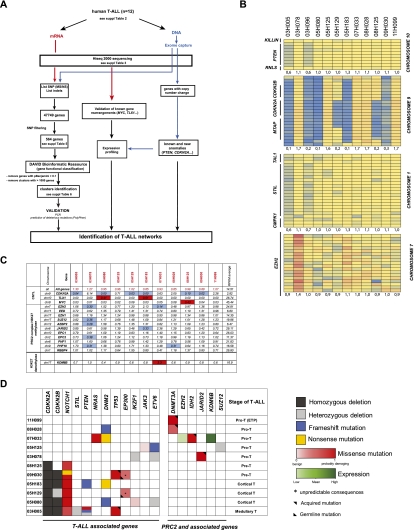
Characterization of genetic anomalies in human adult T-ALL. (A) Flow chart for the identification of genetic alterations in human T-ALL. Transcriptome and exome sequencing allowed the identification of 47,749 nonsynonymous SNPs, indels, and other anomalies (copy number variants and deletions). Following filtering (see the Materials and Methods), 564 genes were retained (listed in Supplemental Table 6). Gene annotation enrichment analysis with DAVID Bioinformatics Resources (Huang et al. 2009) identified chromatin regulators (shown in C,D; Supplemental Fig. 4) and the ubl conjugation pathway as significantly perturbed in these specimens (see Supplemental Table 7). All genetic anomalies were validated using exon sequencing, and acquired mutations were validated as described in the Materials and Methods and are shown in Supplemental Table 8. (B) Copy number variants in selected genes using exon capture sequencing (see the Materials and Methods for details). All chromosomes were manually inspected: Selected genes that appeared relevant (e.g., EZH2) or redundantly deleted (CDKN2A/B) are shown. The correlation between expression level and copy number variation is presented in Supplemental Figure 3B for EZH2. The color code refers to change from mean RPKM values (yellow) per exon. Blue and red indicate lower and higher RPKM values, respectively. (C) Expression of relevant control (CDKN2A, TLX1, and MYC) and EZH2-associated genes in all T-ALL patients studied herein. Data are expressed in relative RPKM values, with mean absolute values per gene is shown in the last column. Note high levels of MYC and TLX1 restricted to leukemia with rearrangements in these genes (see Supplemental Table 2) and low EZH2 expression in two leukemias, including one (07H033) with high KDM6B expression. (D) Representation of mutations, indels, and deletions found in T-ALL genes (left panel) and PRC2 and associated genes (right panel). The functional effects of nonsynonymous substitutions (color gradient) were predicted by the PolyPhen-2 program (http://genetics.bwh.harvard.edu/pph/data ).
Comment in
-
A complex Polycomb issue: the two faces of EZH2 in cancer.Genes Dev. 2012 Apr 15;26(8):751-5. doi: 10.1101/gad.191163.112. Genes Dev. 2012. PMID: 22508723 Free PMC article.
References
-
- Ernst T, Chase AJ, Score J, Hidalgo-Curtis CE, Bryant C, Jones AV, Waghorn K, Zoi K, Ross FM, Reiter A, et al. 2010. Inactivating mutations of the histone methyltransferase gene EZH2 in myeloid disorders. Nat Genet 42: 722–726 - PubMed
-
- Huang DW, Sherman BT, Lempicki RA 2009. Systematic and integrative analysis of large gene lists using DAVID bioinformatics resources. Nat Protoc 4: 44–57 - PubMed
Publication types
MeSH terms
Substances
LinkOut - more resources
Full Text Sources
Molecular Biology Databases