

Residual soil phosphorus as the missing piece in the global phosphorus crisis puzzle
- PMID: 22431593
- PMCID: PMC3341047
- DOI: 10.1073/pnas.1113675109
Residual soil phosphorus as the missing piece in the global phosphorus crisis puzzle
Abstract
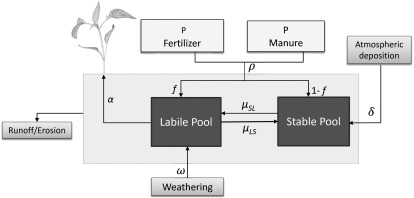
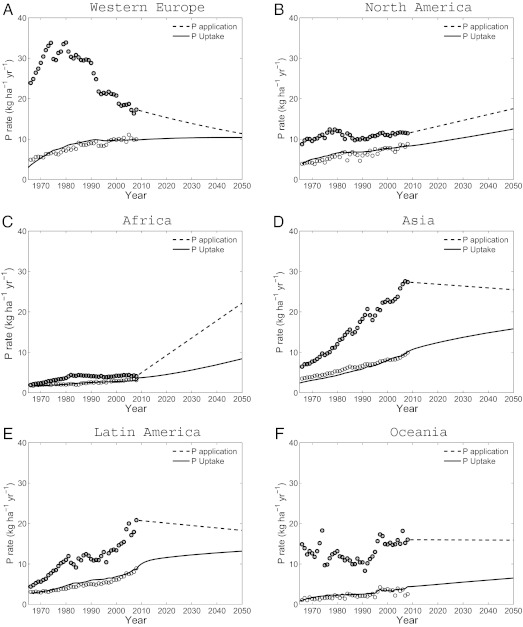
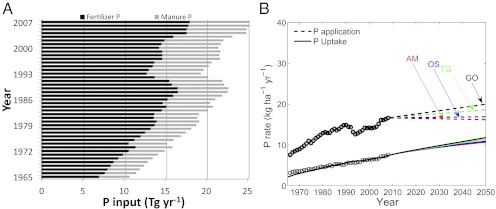
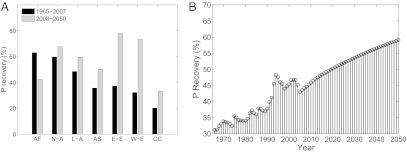
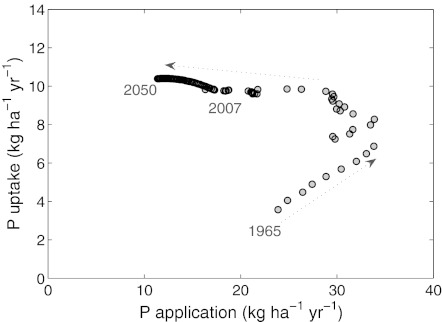
Phosphorus (P) is a finite and dwindling resource. Debate focuses on current production and use of phosphate rock rather than on the amounts of P required in the future to feed the world. We applied a two-pool soil P model to reproduce historical continental crop P uptake as a function of P inputs from fertilizer and manure and to estimate P requirements for crop production in 2050. The key feature is the consideration of the role of residual soil P in crop production. Model simulations closely fit historical P uptake for all continents. Cumulative inputs of P fertilizer and manure for the period 1965-2007 in Europe (1,115 kg . ha(-1) of cropland) grossly exceeded the cumulative P uptake by crops (360 kg ha(-1)). Since the 1980s in much of Europe, P application rates have been reduced, and uptake continues to increase due to the supply of plant-available P from residual soil P pool. We estimate that between 2008 and 2050 a global cumulative P application of 700-790 kg . ha(-1) of cropland (in total 1,070-1,200 teragrams P) is required to achieve crop production according to the various Millennium Ecosystem Assessment scenarios [Alcamo J, Van Vuuren D, Cramer W (2006) Ecosystems and Human Well-Being: Scenarios, Vol 2, pp 279-354]. We estimate that average global P fertilizer use must change from the current 17.8 to 16.8-20.8 teragrams per year in 2050, which is up to 50% less than other estimates in the literature that ignore the role of residual soil P.
Conflict of interest statement
The authors declare no conflict of interest.
Figures
Comment in
-
Agricultural legacies, food production and its environmental consequences.Proc Natl Acad Sci U S A. 2012 Apr 17;109(16):5917-8. doi: 10.1073/pnas.1203766109. Epub 2012 Apr 16. Proc Natl Acad Sci U S A. 2012. PMID: 22509012 Free PMC article. No abstract available.
References
-
- Koning NBJ, et al. Long-term global availability of food: Continued abundance or new scarcity? Neth J Agric Sci. 2008;55:229–292.
-
- Smil V. Phosphorus in the environment: Natural flows and human interferences. Annu Rev Energy Environ. 2000;25:25–53.
-
- Syers JK, Johnston AE, Curtin D. Efficiency of Soil and Fertilizer Phosphorus Use: Reconciling Changing Concepts of Soil Phosphorus Behaviour with Agronomic Information. Rome: Food and Agriculture Organization of the United Nations; 2008.
-
- Déry P, Anderson B. 2007. Peak phosphorus. Energy Bull (August 13). Available at http://www.energybulletin.net/node/33164.
-
- Cordell D, Drangert J, White S. The story of phosphorus: Global food security and food for thought. Glob Environ Change. 2009;19:292–305.
Publication types
MeSH terms
Substances
LinkOut - more resources
Full Text Sources
Other Literature Sources
Molecular Biology Databases
Research Materials
Miscellaneous
