. 2012 Apr 3;109(14):5423-8.
doi: 10.1073/pnas.1114278109. Epub 2012 Mar 19.

High-throughput genotoxicity assay identifies antioxidants as inducers of DNA damage response and cell death

Affiliations

High-throughput genotoxicity assay identifies antioxidants as inducers of DNA damage response and cell death

Jennifer T Fox et al. Proc Natl Acad Sci U S A. .

Abstract

Human ATAD5 is a biomarker for identifying genotoxic compounds because ATAD5 protein levels increase posttranscriptionally in response to DNA damage. We screened over 4,000 compounds with a cell-based quantitative high-throughput ATAD5-luciferase assay detecting genotoxic compounds. We identified 22 antioxidants, including resveratrol, genistein, and baicalein, that are currently used or investigated for the treatment of cardiovascular disease, type 2 diabetes, osteopenia, osteoporosis, and chronic hepatitis, as well as for antiaging. Treatment of dividing cells with these compounds induced DNA damage and resulted in cell death. Despite their genotoxic effects, resveratrol, genistein, and baicalein did not cause mutagenesis, which is a major side effect of conventional anticancer drugs. Furthermore, resveratrol and genistein killed multidrug-resistant cancer cells. We therefore propose that resveratrol, genistein, and baicalein are attractive candidates for improved chemotherapeutic agents.


Conflict of interest statement

The authors declare no conflict of interest.

Figures
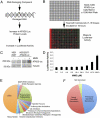
Fig. 1.
Fig. 1.
The ATAD5-luc assay. (A) The assay is based on the observation that treatment with DNA damaging agents results in an increase in ATAD5 protein levels. Genotoxic compounds can be identified by monitoring their effect on luciferase activity in the ATAD5-luc cell line. (B) Protocol for compound screening in a 1,536-well plate format. The red and green represent cells that display an increase and decrease in ATAD5-luc activity, respectively, following treatment with a chemical. (C) The expression of the ATAD5-luc fusion protein was increased after a 16-h incubation with 295 μM MMS. (D) Luciferase activity was increased in response to a 16-h incubation with MMS in a dose-dependent manner. (E) The 99 positive hits grouped by cellular function. (F) Of the 51 positive hits that were evaluated, 24 (47%) had previously been identified as genotoxins by the S. typhimurium reverse-mutation assay, the HPRT assay, the mouse lymphoma thymidine kinase assay, a test for chromosomal aberrations, and a micronucleus assay. Twenty-five (49%) had not been thoroughly tested in standard genotoxicity assays, but were found to induce a DNA damage response and are thus classified as newly identified genotoxins. Two compounds (4%) did not induce a DNA damage response.
Fig. 2.
Fig. 2.
Polyphenols/antioxidants identified from the ATAD5-luc screen induce genotoxicity. (A) HEK293T cells were treated with 92 μM polyphenols/antioxidants (the concentration that produced the greatest increase in luciferase activity in the evaluation) or 10 μM cisplatin for 16 h, or 1.18 mM MMS for 1 h followed by a 5-h recovery. The level of the indicated proteins was determined by Western blot analysis using either the chromatin-bound fraction or total cell lysate. (B) The percentage of HEK293T metaphase cells containing the indicated number of chromatid breaks following treatment as described in A was determined in at least 50 metaphases per treatment. (C) HEK293T cells were treated as described in A, and DNA DSBs were visualized by pulsed-field gel electrophoresis. The intensity of the smear produced by DNA containing DSBs was quantified using ImageJ and normalized to the DMSO control. The graph represents the average of at least three independent experiments ± SD. (D) YFP-Polη foci were counted in at least 60 HEK293T cells after treatment with 92 μM polyphenols/antioxidants or 10 μM cisplatin for 16 h. (E) Cell-cycle profiles of HEK293T cells after treatment with 92 μM polyphenols/antioxidants, 1.18 mM MMS, or 10 μM cisplatin for the indicated times (Note: the times listed for MMS are recovery times following treatment for 1 h).
Fig. 3.
Fig. 3.
Viability of multidrug resistant (KB-V1) and parental (KB-3-1) cells following a 24-h treatment with 0–250 μM of (A) resveratrol, (B) genistein, (C) baicalein, and (D) MMS. Viability was determined using CellTiter-Glo immediately following treatment. The data represent the average of three independent experiments ± SD.
Fig. 4.
Fig. 4.
Resveratrol, baicalein, and genistein do not cause mutagenesis or chromosomal rearrangements. (A) HEK293T cells transfected with either control or Polη siRNA were treated with 230 μM resveratrol, baicalein, or genistein for 16 h, 10 μM cisplatin for 16 h, or 1.18 mM MMS for 1 h. Mutation frequency was determined by the SupF plasmid mutagenesis assay with DMSO control normalization. The numbers below the graph indicate the percentage of viable cells 7 d after treatment as determined by the colony formation assay. The expression of Polη after siRNA knockdown was determined by Western blotting. (B) Log-phase cultures of Saccharomyces cerevisiae (RDKY3615) were treated with 1 mM resveratrol, baicalein, or genistein, or 2.39 mM MMS for 4 h. Gross chromosomal rearrangement (GCR) frequency was determined by counting colonies resistant to canavanine and 5-fluoroorotic acid. The fold-induction of GCR frequency was normalized to the DMSO control. (C) Log-phase cultures of S. cerevisiae (M136-11B) were treated as described in B, and the recombination frequency was determined by counting colonies grown on a plate without histidine and normalized to the DMSO control. Each graph in A, B, and C represents the average of at least two experiments ± SD. The numbers below the graph in B and C indicate the percentage of viable cells following treatment as determined by the yeast survival assay.

Comment in

References

    1. Banerjee S, Sikdar N, Myung K. Suppression of gross chromosomal rearrangements by a new alternative replication factor C complex. Biochem Biophys Res Commun. 2007;362:546–549. - PMC - PubMed
    1. Majka J, Burgers PM. The PCNA-RFC families of DNA clamps and clamp loaders. Prog Nucleic Acid Res Mol Biol. 2004;78:227–260. - PubMed
    1. Bell DW, et al. Predisposition to cancer caused by genetic and functional defects of mammalian Atad5. PLoS Genet. 2011;7:e1002245. - PMC - PubMed
    1. Fox JT, Lee KY, Myung K. Dynamic regulation of PCNA ubiquitylation/deubiquitylation. FEBS Lett. 2011;585:2780–2785. - PMC - PubMed
    1. Lee KY, et al. Human ELG1 regulates the level of ubiquitinated proliferating cell nuclear antigen (PCNA) through Its interactions with PCNA and USP1. J Biol Chem. 2010;285:10362–10369. - PMC - PubMed

Publication types

LinkOut - more resources