

CLCA2 as a p53-inducible senescence mediator
- PMID: 22431922
- PMCID: PMC3306259
- DOI: 10.1593/neo.111700
CLCA2 as a p53-inducible senescence mediator
Abstract
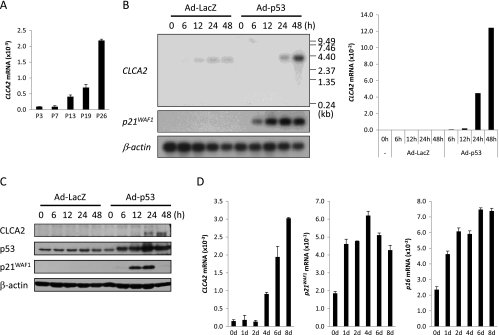
p53 is a tumor suppressor gene that is frequently mutated in multiple cancer tissues. Activated p53 protein regulates its downstream genes and subsequently inhibits malignant transformation by inducing cell cycle arrest, apoptosis, DNA repair, and senescence. However, genes involved in the p53-mediated senescence pathway are not yet fully elucidated. Through the screening of two genome-wide expression profile data sets, one for cells in which exogenous p53 was introduced and the other for senescent fibroblasts, we have identified chloride channel accessory 2 (CLCA2) as a p53-inducible senescence-associated gene. CLCA2 was remarkably induced by replicative senescence as well as oxidative stress in a p53-dependent manner. We also found that ectopically expressed CLCA2 induced cellular senescence, and the down-regulation of CLCA2 by small interfering RNA caused inhibition of oxidative stress-induced senescence. Interestingly, the reduced expression of CLCA2 was frequently observed in various kinds of cancers including prostate cancer, whereas its expression was not affected in precancerous prostatic intraepithelial neoplasia. Thus, our findings suggest a crucial role of p53/CLCA2-mediated senescence induction as a barrier for malignant transformation.
Figures


Similar articles
-
CLCA2, a target of the p53 family, negatively regulates cancer cell migration and invasion.Cancer Biol Ther. 2012 Dec;13(14):1512-21. doi: 10.4161/cbt.22280. Epub 2012 Sep 18. Cancer Biol Ther. 2012. PMID: 22990203 Free PMC article.
-
RRM2B suppresses activation of the oxidative stress pathway and is up-regulated by p53 during senescence.Sci Rep. 2012;2:822. doi: 10.1038/srep00822. Epub 2012 Nov 8. Sci Rep. 2012. PMID: 23139867 Free PMC article.
-
p53-dependent induction of prostate cancer cell senescence by the PIM1 protein kinase.Mol Cancer Res. 2010 Aug;8(8):1126-41. doi: 10.1158/1541-7786.MCR-10-0174. Epub 2010 Jul 20. Mol Cancer Res. 2010. PMID: 20647331 Free PMC article.
-
Senescence and aging: the critical roles of p53.Oncogene. 2013 Oct 24;32(43):5129-43. doi: 10.1038/onc.2012.640. Epub 2013 Feb 18. Oncogene. 2013. PMID: 23416979 Review.
-
The Regulation of Cellular Functions by the p53 Protein: Cellular Senescence.Cold Spring Harb Perspect Med. 2017 Feb 1;7(2):a026112. doi: 10.1101/cshperspect.a026112. Cold Spring Harb Perspect Med. 2017. PMID: 27881444 Free PMC article. Review.
Cited by
-
Robust p53 phenotypes and prospective downstream targets in telomerase-immortalized human cells.Oncotarget. 2025 Feb 18;16:79-100. doi: 10.18632/oncotarget.28690. Oncotarget. 2025. PMID: 39969205 Free PMC article.
-
Gene identification for risk of relapse in stage I lung adenocarcinoma patients: a combined methodology of gene expression profiling and computational gene network analysis.Oncotarget. 2016 May 24;7(21):30561-74. doi: 10.18632/oncotarget.8723. Oncotarget. 2016. PMID: 27081700 Free PMC article.
-
Microenvironment Stiffness Amplifies Post-ischemia Heart Regeneration in Response to Exogenous Extracellular Matrix Proteins in Neonatal Mice.Front Cardiovasc Med. 2021 Nov 5;8:773978. doi: 10.3389/fcvm.2021.773978. eCollection 2021. Front Cardiovasc Med. 2021. PMID: 34805326 Free PMC article.
-
SATB1 expression is associated with biologic behavior in colorectal carcinoma in vitro and in vivo.PLoS One. 2013;8(1):e47902. doi: 10.1371/journal.pone.0047902. Epub 2013 Jan 11. PLoS One. 2013. PMID: 23326301 Free PMC article.
-
Emerging roles for multifunctional ion channel auxiliary subunits in cancer.Cell Calcium. 2019 Jun;80:125-140. doi: 10.1016/j.ceca.2019.04.005. Epub 2019 Apr 25. Cell Calcium. 2019. PMID: 31071485 Free PMC article. Review.
References
-
- Soussi T, Asselain B, Hamroun D, Kato S, Ishioka C, Claustres M, Beroud C. Meta-analysis of the p53 mutation database for mutant p53 biological activity reveals a methodologic bias in mutation detection. Clin Cancer Res. 2006;12:62–69. - PubMed
-
- Vogelstein B, Lane D, Levine AJ. Surfing the p53 network. Nature. 2000;408:307–310. - PubMed
-
- Matsuda K, Yoshida K, Taya Y, Nakamura K, Nakamura Y, Arakawa H. p53AIP1 regulates the mitochondrial apoptotic pathway. Cancer Res. 2002;62:2883–2889. - PubMed
-
- Tanaka H, Arakawa H, Yamaguchi T, Shiraishi K, Fukuda S, Matsui K, Takei Y, Nakamura Y. A ribonucleotide reductase gene involved in a p53-dependent cell-cycle checkpoint for DNA damage. Nature. 2000;404:42–49. - PubMed
-
- el-Deiry WS. Regulation of p53 downstream genes. Semin Cancer Biol. 1998;8:345–357. - PubMed
Publication types
MeSH terms
Substances
LinkOut - more resources
Full Text Sources
Research Materials
Miscellaneous