. 2012;7(3):e33154.
doi: 10.1371/journal.pone.0033154. Epub 2012 Mar 14.

Composition and localization of lipids in Penaeus merguiensis ovaries during the ovarian maturation cycle as revealed by imaging mass spectrometry

Affiliations

Composition and localization of lipids in Penaeus merguiensis ovaries during the ovarian maturation cycle as revealed by imaging mass spectrometry

Piyachat Chansela et al. PLoS One. 2012.

Abstract

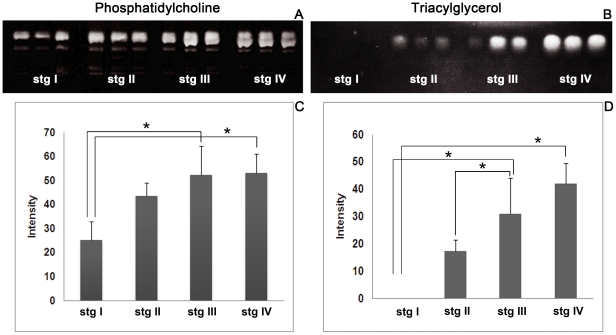
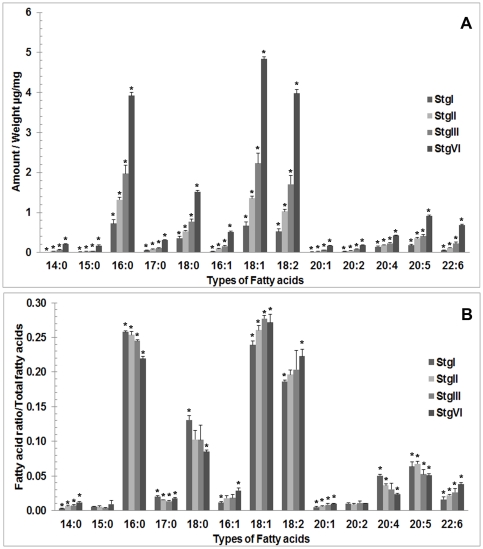
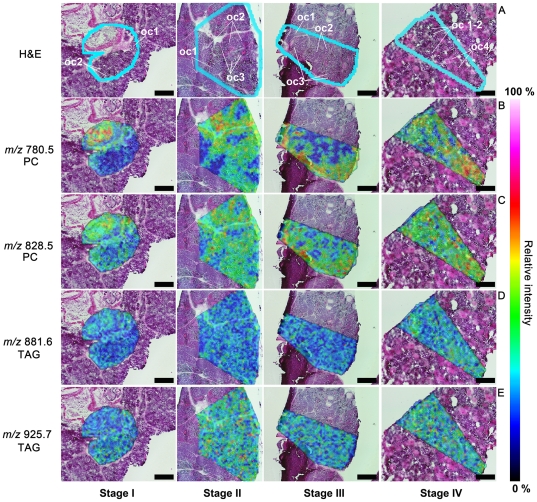
Ovary maturation, oocyte differentiation, and embryonic development in shrimp are highly dependent on nutritional lipids taken up by female broodstocks. These lipids are important as energy sources as well as for cell signaling. In this study, we report on the compositions of major lipids, i.e. phosphatidylcholines (PCs), triacylglycerols (TAGs), and fatty acids (FAs), in the ovaries of the banana shrimp, Penaeus merguiensis, during ovarian maturation. Thin-layer chromatography analysis showed that the total PC and TAG signal intensities increased during ovarian maturation. Further, by using gas chromatography, we found that (1) FAs 14:0, 16:1, 18:1, 18:2, 20:1, and 22:6 proportionally increased as ovarian development progressed to more mature stages; (2) FAs 16:0, 18:0, 20:4, and 20:5 proportionally decreased; and (3) FAs 15:0, 17:0, and 20:2 remained unchanged. By using imaging mass spectrometry, we found that PC 16:0/16:1 and TAG 18:1/18:2/22:6 were detected in oocytes stages 1 and 2. PCs 16:1/20:4, 16:0/22:6, 18:3/22:6, 18:1/22:6, 20:5/22:6, and 22:6/22:6 and TAGs 16:0/16:1/18:3, 16:0/18:1/18:3, 16:0/18:1/18:1, and 16:0/18:2/22:6 were present in all stages of oocytes. In contrast, the PC- and TAG-associated FAs 20:4, 20:5, and 22:6 showed high signal intensities in stage 3 and 4 oocytes. These FAs may act as nutrition sources as well as signaling molecules for developing embryos and the hatching process. Knowledge of lipid compositions and localization could be helpful for formulating the diet for female broodstocks to promote fecundity and larval production.


Conflict of interest statement

Competing Interests: The authors have declared that no competing interests exist.

Figures

Figure 1
Figure 1. Hematoxylin-and eosin (H&E)-stained paraffin-embedded sections of ovaries at various stages.
The ovaries are composed of lobules separated by connective tissue septae called trabeculae (Tr), with each lobule containing a variety of oocytes surrounded by follicular cells. (A,B) In the stage I ovary (the spent stage), the germ cells present are the oogonia (Og) in the oogenic zone (Oz) and stage 1 oocytes (Oc1) and stage 2 oocytes (Oc2) in the previtellogenic zone (PZ). (C,D) In the stage II ovary (the proliferative stage), the predominant cells are the stage 2 oocytes (Oc2) located in the previtellogenic zone (Pz), while Og and Oc1 are present to a lesser degree. (E,F) In stage III ovaries (the premature stage), the majority of oocytes at stage 3 oocytes (Oc 3) are located in the vitellogenic zone (VZ). Oc3 increase in size during maturation and contain increasing amounts of lipid droplets. The cytoplasm of these oocytes stains pink due to increased eosinophilia. (G,H) In the stage IV ovary (the mature stage), the mature oocytes (Oc4) are the largest and most abundant cells. Oc4 are located in the mature zone (MZ), which occupies almost the entirety of each lobule. The mature oocytes are identifiable by the highly eosinophilic cytoplasm, which is stained a deep pink by the eosin. The cytoplasm of these oocytes contains cortical rods; the oocytes are surrounded by follicular cells (Fc).
Figure 2
Figure 2. TLC-blots of lipids extracted from ovaries at various stages.
(A) Phosphatidylcholines (PCs) separated on TLC-blot membranes, which show that the PC band increases in prominence from ovarian stages I to III and remains constant from ovarian stages III to IV. (C) The histograms of the signal intensities from TLC-blots confirm a similar trend in the changing levels of PC. (B) Triacylglycerides (TAGs) separated on TLC-blot membranes show that the TAGs are not detectable at stage I but dramatically increased from stages II–IV. (D)This pattern was also confirmed by histograms of TAG signal intensities. The significant differences of the results among the 4 stages were tested by Scheffe's method. The bars show standard deviations, and the asterisks indicate significant differences between stages (p<0.05).
Figure 3
Figure 3. Histograms showing the average amount of each fatty acid (FA) per ovarian weight (µg/mg) (A) and the ratios between each FA per total amount of FAs (B) as detected in each ovarian stage.
The average amounts of all the FAs tended to increase during ovarian development. However, the ratios between each FA per total amount of FA show 3 different patterns during the course of ovarian development. The ratios decreased for FAs 16∶0, 18∶0, 20∶4, and 20∶5; increased for FAs 14∶0, 16∶1, 18∶2, 18∶1, 20∶1, and 22∶6; and remained unchanged for FAs 15∶0, 17∶0 and 20∶2. Significant differences among the 4 stages for each FA were tested by Scheffe's method. The bars show standard deviations, and asterisks show significant difference for each fatty acid. (p<0.05).
Figure 4
Figure 4. Imaging mass spectrometry (IMS) showing the distribution of PCs and TAGs on ovarian tissue sections.
After IMS analysis, the tissue sections were further stained with H&E; the regions analyzed (blue lines) are shown on the H&E-stained sections (A). The observed signals from the IMS analysis were merged with the H&E images. These IMS images exhibit PC molecules at m/z 780.5 (B) and 828.5 (C) and TAG molecules at m/z 881.6 (D) and 925.7 (E). The PC molecule at m/z 780.5 showed intense distribution in late stage oocytes (Oc3 and Oc4) (B), whereas the molecule at m/z 828.5 showed distribution in all oocyte stages, with the most intense signal occurring in Oc3 and Oc4. For the TAGs, the molecules at m/z 881.6 and 925.7 were found distributed with similar intensity in all oocyte stages. The distribution of the other observed molecules are shown in Table 2 (the PCs) and 3 (the TAGs). The black scale bars represent 400 µm.
Figure 5
Figure 5. The identification of PCs (A,B) and TAG (C,D) species by MS/MS analysis.
Molecules found from the TLC-blot and IMS analyses were subjected to identification by MS/MS analysis. In case of the PCs, the example molecules m/z 780.5 (A) and m/z 828.5 (B) are shown as fragmented ions after MS/MS analysis. These molecules were characterized as PC (16∶0/18∶2)+Na and (16∶0/22∶6)+Na, respectively. The identification of these molecules was based on the observed fragmented ions that showed the neutral loss property of FA moieties. In the case of TAGs, the example molecules m/z 881.6 (C) and 925.7 (D) are shown. In the TAG mass spectra, the peaks that correspond to neutral loss of FA could be observed directly. The molecule at m/z 881.6 was assigned as TAG (16∶0/18∶1/18∶1)+Na, and the molecule at m/z 925.7 was assigned as TAG (16∶0/18∶2/22∶6)+Na according to the observed neutral loss peaks. The molecular species of each molecule are shown in Tables 2 (PCs) and 3 (TAGs).

References

    1. Hoanga T, Leea SY, Keenanb CP, Marsden GE. Effect of temperature on spawning of Penaeus merguiensis. J Therm Biol. 2002;27:433–437.
    1. Phongdara A, Chotigeat W, Chandumpai A, Tanthana C, Duangtong P. Identification of Penaeus merguiensis and Penaeus indicus by RAPD-PCR derived DNA markers. Science Asia. 1999;25:143–151.
    1. Ravid T, Tietz A, Khayat M, Boehm E, Michelis R, et al. Lipid accumulation in the ovaries of a marine shrimp Penaeus semisulcatus (De Haan). J Exp Biol. 1999;202:1819–1829. - PubMed
    1. Clarke A. Lipid class and fatty acid composition of Chorzsmus antarctzcus (Pfeffer) (Crustacea: decapoda) at south georgia. J exp mar Biol Ecol. 1977;28:297–314.
    1. Wouters R, Molina C, Lavens P, Calderon J. Lipid composition and vitamin content of wild female Litopenaeus vannamei in different stages of sexual maturation. Aquaculture. 2001;198:307–323.

Publication types