

Genome stability of Lyme disease spirochetes: comparative genomics of Borrelia burgdorferi plasmids
- PMID: 22432010
- PMCID: PMC3303823
- DOI: 10.1371/journal.pone.0033280
Genome stability of Lyme disease spirochetes: comparative genomics of Borrelia burgdorferi plasmids
Abstract
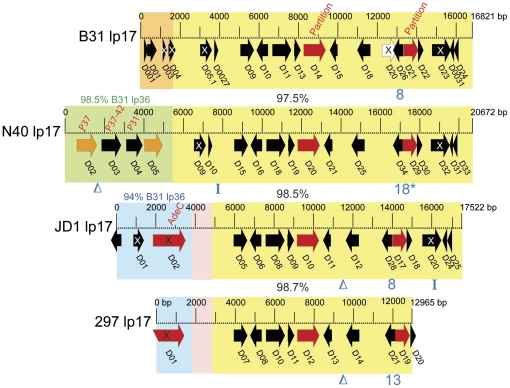
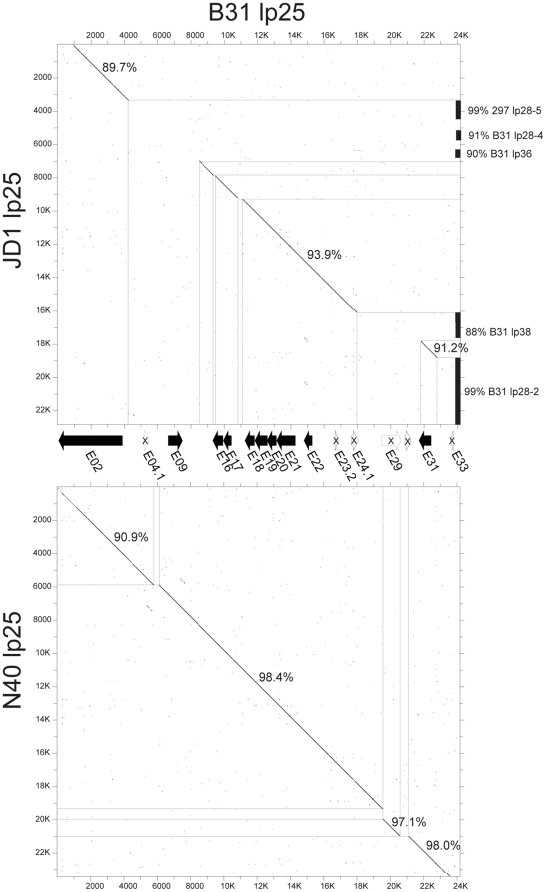
Lyme disease is the most common tick-borne human illness in North America. In order to understand the molecular pathogenesis, natural diversity, population structure and epizootic spread of the North American Lyme agent, Borrelia burgdorferi sensu stricto, a much better understanding of the natural diversity of its genome will be required. Towards this end we present a comparative analysis of the nucleotide sequences of the numerous plasmids of B. burgdorferi isolates B31, N40, JD1 and 297. These strains were chosen because they include the three most commonly studied laboratory strains, and because they represent different major genetic lineages and so are informative regarding the genetic diversity and evolution of this organism. A unique feature of Borrelia genomes is that they carry a large number of linear and circular plasmids, and this work shows that strains N40, JD1, 297 and B31 carry related but non-identical sets of 16, 20, 19 and 21 plasmids, respectively, that comprise 33-40% of their genomes. We deduce that there are at least 28 plasmid compatibility types among the four strains. The B. burgdorferi ∼900 Kbp linear chromosomes are evolutionarily exceptionally stable, except for a short ≤20 Kbp plasmid-like section at the right end. A few of the plasmids, including the linear lp54 and circular cp26, are also very stable. We show here that the other plasmids, especially the linear ones, are considerably more variable. Nearly all of the linear plasmids have undergone one or more substantial inter-plasmid rearrangements since their last common ancestor. In spite of these rearrangements and differences in plasmid contents, the overall gene complement of the different isolates has remained relatively constant.
Conflict of interest statement
Figures


Similar articles
-
Plasmid diversity and phylogenetic consistency in the Lyme disease agent Borrelia burgdorferi.BMC Genomics. 2017 Feb 15;18(1):165. doi: 10.1186/s12864-017-3553-5. BMC Genomics. 2017. PMID: 28201991 Free PMC article.
-
Natural selection and recombination at host-interacting lipoprotein loci drive genome diversification of Lyme disease and related bacteria.mBio. 2024 Sep 11;15(9):e0174924. doi: 10.1128/mbio.01749-24. Epub 2024 Aug 15. mBio. 2024. PMID: 39145656 Free PMC article.
-
Primordial origin and diversification of plasmids in Lyme disease agent bacteria.BMC Genomics. 2018 Mar 27;19(1):218. doi: 10.1186/s12864-018-4597-x. BMC Genomics. 2018. PMID: 29580205 Free PMC article.
-
The plasmids of Borrelia burgdorferi: essential genetic elements of a pathogen.Plasmid. 2005 Jan;53(1):1-13. doi: 10.1016/j.plasmid.2004.10.006. Epub 2004 Dec 16. Plasmid. 2005. PMID: 15631949 Review.
-
Evolutionary genomics of Borrelia burgdorferi sensu lato: findings, hypotheses, and the rise of hybrids.Infect Genet Evol. 2014 Oct;27:576-93. doi: 10.1016/j.meegid.2014.03.025. Epub 2014 Apr 3. Infect Genet Evol. 2014. PMID: 24704760 Free PMC article. Review.
Cited by
-
Peaceful coexistence amongst Borrelia plasmids: getting by with a little help from their friends?Plasmid. 2013 Sep;70(2):161-7. doi: 10.1016/j.plasmid.2013.05.002. Epub 2013 May 30. Plasmid. 2013. PMID: 23727020 Free PMC article. Review.
-
Identification of the minimal cytolytic unit for streptolysin S and an expansion of the toxin family.BMC Microbiol. 2015 Jul 24;15:141. doi: 10.1186/s12866-015-0464-y. BMC Microbiol. 2015. PMID: 26204951 Free PMC article.
-
FtlA and FtlB Are Candidates for Inclusion in a Next-Generation Multiantigen Subunit Vaccine for Lyme Disease.Infect Immun. 2022 Oct 20;90(10):e0036422. doi: 10.1128/iai.00364-22. Epub 2022 Sep 14. Infect Immun. 2022. PMID: 36102656 Free PMC article.
-
Genetics of Borrelia burgdorferi.Annu Rev Genet. 2012;46:515-36. doi: 10.1146/annurev-genet-011112-112140. Epub 2012 Sep 4. Annu Rev Genet. 2012. PMID: 22974303 Free PMC article. Review.
-
Middle region of the Borrelia burgdorferi surface-located protein 1 (Lmp1) interacts with host chondroitin-6-sulfate and independently facilitates infection.Cell Microbiol. 2016 Jan;18(1):97-110. doi: 10.1111/cmi.12487. Epub 2015 Aug 31. Cell Microbiol. 2016. PMID: 26247174 Free PMC article.
References
-
- Steere AC. Lyme disease. N Engl J Med. 2001;345:115–125. - PubMed
-
- Steere AC. Lyme borreliosis in 2005, 30 years after initial observations in Lyme Connecticut. Wien Klin Wochenschr. 2006;118:625–633. - PubMed
-
- Feder HM, Jr, Johnson BJ, O'Connell S, Shapiro ED, Steere AC, et al. A critical appraisal of “chronic Lyme disease”. N Engl J Med. 2007;357:1422–1430. - PubMed
-
- Kurtenbach K, Hanincova K, Tsao JI, Margos G, Fish D, et al. Fundamental processes in the evolutionary ecology of Lyme borreliosis. Nat Rev Microbiol. 2006;4:660–669. - PubMed
Publication types
MeSH terms
Substances
Grants and funding
LinkOut - more resources
Full Text Sources
Medical
