. 2012;7(3):e33338.
doi: 10.1371/journal.pone.0033338. Epub 2012 Mar 14.

Functional and molecular characterization of rod-like cells from retinal stem cells derived from the adult ciliary epithelium

Affiliations

Functional and molecular characterization of rod-like cells from retinal stem cells derived from the adult ciliary epithelium

Gian Carlo Demontis et al. PLoS One. 2012.

Erratum in

  • PLoS One. 2012;7(8): doi/10.1371/annotation/ca21f359-8e8e-4c3d-8308-e0f20fc446bb

Abstract

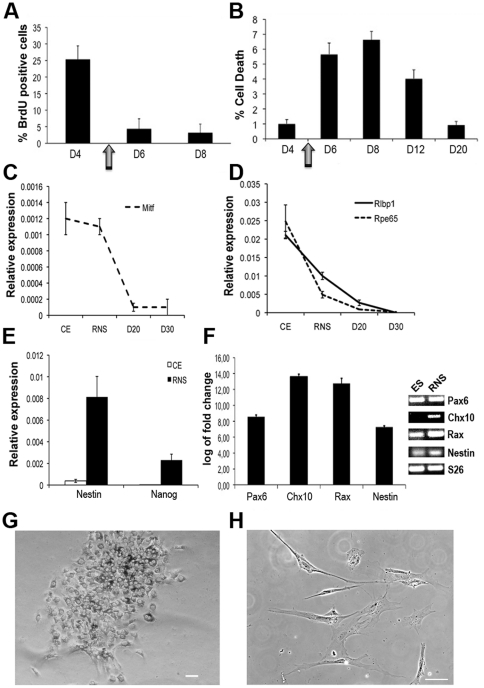
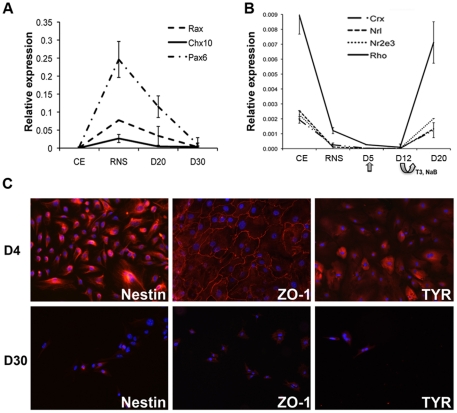
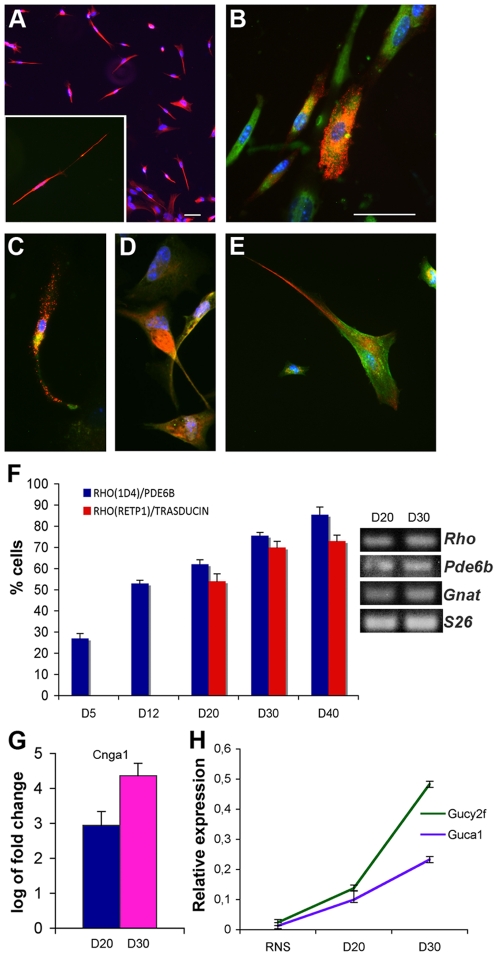
In vitro generation of photoreceptors from stem cells is of great interest for the development of regenerative medicine approaches for patients affected by retinal degeneration and for high throughput drug screens for these diseases. In this study, we show unprecedented high percentages of rod-fated cells from retinal stem cells of the adult ciliary epithelium. Molecular characterization of rod-like cells demonstrates that they lose ciliary epithelial characteristics but acquire photoreceptor features. Rod maturation was evaluated at two levels: gene expression and electrophysiological functionality. Here we present a strong correlation between phototransduction protein expression and functionality of the cells in vitro. We demonstrate that in vitro generated rod-like cells express cGMP-gated channels that are gated by endogenous cGMP. We also identified voltage-gated channels necessary for rod maturation and viability. This level of analysis for the first time provides evidence that adult retinal stem cells can generate highly homogeneous rod-fated cells.


Conflict of interest statement

Competing Interests: The authors have declared that no competing interests exist.

Figures

Figure 1
Figure 1. Differentiation of cells from RNS.
(A–B) Changes in cells proliferation (BrdU) (A) or cell death (B) were analyzed at different times before and after treatment with differentiation medium at day 5 (indicated by an arrow). Data are derived from 8 fields from 2 independent experiments and represented as mean +/− s.e.m. (CD) Real-time PCR analyses of CE markers Mitf (C), Rpe65 (D) and Rlbp1 (D; also expressed in Müller glia) show lower or similar levels in retinal neurospheres (RNS) compared to the ciliary epithelium (CE) and down-regulation of these genes during differentiation. (E) Real-time PCR analysis confirms higher levels of Nestin and Nanog mRNAs in RNS (black bars) compared to CE (white bars). In C, D and E data derive from the formula 2−ΔCt. S26 was used as reference gene. (F) Real-time PCR analysis of retinal progenitors markers (Pax6, Chx10, Rax and Nestin) in RNS compared to expression in undifferentiated ES (set as 0). On the right-hand side of the graph the Real-time PCR products, after separation in an agarose gel, are shown. (G–H) Bright field images of cells at D4 (G) and D30 (H) show pigmentation reduction and changes in morphology in cells differentiated for 30 days. Scale bar is 50 µm.
Figure 2
Figure 2. Expression analysis of RNS and differentiated cells compared to CE.
(A) Real-time PCR analyses of retinal progenitor genes Rax, Chx10 and Pax6 show higher levels in retinal neurospheres (RNS) compared to the ciliary epithelium (CE) and down-regulation of these genes after 20 and 30 days of differentiation (D20-D30). (B) Time course analysis of mRNA levels of Rho, Crx, Nrl and Nr2e3 in CE, RNS and cells at D5 (the day of exposure to differentiation medium, indicated by an arrow), D12 after 7 days in the presence of RA, taurine, T3 and sodium butyrate (bended arrow indicates withdrawal of T3 and sodium butyrate at this time point) and at D20 after removal of T3 and sodium butyrate. In A and B data derive from the formula 2−ΔCt. S26 was used as reference gene. (C) Immunofluorescence experiments with antibodies detecting Nestin, ZO-1 and Tyrosinase (TYR) demonstrate the loss of expression of these proteins (red staining) upon differentiation. Upper row shows cells at D4 (before exposure to differentiation medium), lower row shows cells after 30 days of differentiation (D30). Blue shows nuclei labeled by DAPI.
Figure 3
Figure 3. Expression of components of the phototransduction cascade in RNS-derived rods.
RNS-derived rods were analyzed after 40 days of differentiation. Rho protein at the cell surface was detected with two different monoclonal antibodies: 1D4 (A) and RET-P1 (B). The magnification in A shows an example of a Rho+ cell labeled with 1D4 recognizing an intracellular epitope and requiring permeabilization of the sample. The antibody recognizing an extracellular epitope (RET-P1) and therefore detecting the protein at the cell surface (B) is characterized by a different labeling compared to the staining with 1D4 (A). (B) Double-labeling with antibodies for Rho (red) and Transducin (green). (C) Double-labeling with antibodies for Rho (red, RET-P1) and Recoverin (green). (D) Double-labeling with antibodies for Rho (red, 1D4) and peripherin (green). (E) Double-labeling with antibodies for Rho (red, 1D4) and Pde6b (green). Scale bars are 50 µm. Scale bar for C, D and E are equal to that shown in B. (F) Time course experiment analyzing RNS-derived cells co-expressing either Rho (1D4)+Pde6b (blue bars) or Rho (RET-P1)+Transducin (red bars) at different times of differentiation in vitro. Data are represented as mean +/− s.e.m. and derived from 10 fields from 2 independent experiments. On the right-hand side we show mRNA for Rho, Pde6b, Gnat1 (transducin) and S26 detected by RT-PCR at D20 and D30 confirming the expression these genes. (G) Real-time PCR for Cnga1 mRNA shows an increase in RNS-derived cells after 20 (D20) and 30 (D30) days of differentiation compared to expression in RNS (set as 0). (H) Real-time PCR for Gucy2f and Guca1 show up-regulation of these genes during differentiation. Data derive from the formula 2−ΔCt.
Figure 4
Figure 4. RNS-derived cells infected with AAV2/8-pRho-EGFP.
RNS-derived cells were infected with AAV2/8-pRho-EGFP 4 days after seeding on ECM and analyzed after 30 days of differentiation. Expression of EGFP was evaluated at the fluorescence microscope (green in B, C, E and F) and co-expression of rod specific proteins was evaluated by immunolabeling with anti-Transducin (red in A and C) and anti-Rhodopsin antibodies (red in D and F). Blue is DAPI staining of nuclei in merged images (C and F).
Figure 5
Figure 5. cGMP-gated currents in RNS-derived rod-like photoreceptors.
(A) I/V relations before (red, CNTR), during (green, cG) and after (blue, WASH) application of 25 µM 8-Br-cGMP. (B) Membrane resistance changes during the 90 s-long 8-Br-cGMP application (green bar). CNTR, cG and WASH mark the time of acquisition of sweeps plotted in A. (C) I/V curves from a cell with low fluorescence (see Methods) before (red, CNTR) or during (green, cG) exposure to 25 µM 8-Br-cGMP. Each trace is the average of 4 sweeps. (D) 100 ms-long current stretches recorded before (red) or during (green) application of 25 µM 8-Br-cGMP. Dotted blue lines were drawn at 6 pA intervals. (E) Power spectrum (circles) of 8-Br-cGMP-induced current (see Methods) with the best fit by Eq. 3 (red line). (F) I/V in Locke's saline with 0-added Ca2+ before (red) or during (green) application of 100 µM 8-Br-cGMP. (G) Net currents activated by the cGMP analogue for cells in A (purple) and F (orange). Purple and orange arrows indicate reversal potentials in 2 mM (N = 7) and in 0-added Ca2+ (N = 3), respectively. (H and I) I/V curves before (red sweep) and during (green trace) application of 20 µM 8-Br-cGMP in a D20 (H) and in a D30 (I) RNS-derived rod. Current densities were computed using capacitances of 35 (H) and 29 pF (I). Vertical deflections in A, C, F, H and I are perfusion artifacts. (J) Average current densities at −80 mV for D20 (blue, N = 9) and D30 (purple, N = 7) RNS-derived cells, before (open bars) and during (filled bars) application of the cGMP analogue. Average capacitances were 25.2±4.9 pF and 38.98±7.21 pF at D20 and D30. (K) Average net current densities at D20 (blue, N = 7) and D30 (magenta, N = 9). (L) Net current densities as a function of basal current (before 8-Br-cGMP application) at −80 mV for D30 (magenta) and D20 (blue) cells. (M) Average fluorescence intensity per area of Ca2+ accumulation for D20 (blue) and D30 (purple) cells incubated in the absence (open bars, D20 N = 33; D30 N = 20) or in the presence (filled bars, D20 N = 21; D30 N = 19) of 20 µM 8-Br-cGMP. *, P<0.05; **, P<0.01; ***, P<0.001, Tukey's tests after two-way ANOVA. In A, C, F, H, I images of recorded cell are above records.
Figure 6
Figure 6. IBMX-gated currents in RNS-derived rod-like photoreceptors.
(A) I/V relations for a D30 cell before (red, CNTR), during (green, IBMX) and after (blue, WASH) perfusion with 1 mM IBMX. (B) Membrane resistance changes during the 120s-long IBMX application (green bar). CNTR, IBMX and WASH mark the time of acquisition of sweeps plotted in A. The perfusion line was preloaded with IBMX. The initial increase in membrane resistance with IBMX was a perfusion artifact. (C) I/V relations for a D30 cell before (red, CNTR) and during (green, IBMX) perfusion with 1 mM IBMX in 0-added Ca2+. (D) Net IBMX-activated currents, computed from traces in A (purple) and C (orange). Reversal potentials are indicated by the purple and orange arrows. (E) Average reversal potentials in 2 mM Ca2+ (filled bars) or in 0-added Ca2+ (striped bars) of IBMX-induced (blue) and 8-Br-cGMP (magenta) currents. The effect of calcium on reversal potential was significant (P<0.001 by two-way ANOVA). (F) Average current densities before (red) and during (green) 1 mM IBMX application, in 2 mM (filled bars, N = 6) or 0-added Ca2+ (striped bars, N = 3). (G) Net current densities as a function of normalized basal current of D30 cells in response to 8-Br-cGMP (magenta) or IBMX (blue). (H) Average cGMP accumulation by D30 cells, in the absence (red - CNTR) and in the presence of 0.5 and 2 mM IBMX (green). The difference between control and 2 mM IBMX was significant. (I) Average calcium accumulation in control medium (red – CNTR, N = 20) and in 2 mM IBMX (green – IBMX, N = 29). *, P<0.05; **, P<0.01; ***, P<0.001, by one-way ANOVA followed by Tukey's tests. In A and C images of recorded cell are above records.
Figure 7
Figure 7. Light response of RNS-derived rods.
(A) Responses to flashes delivering 719,500 (red) and 144,600 (blue) photons µm−2, respectively. Each trace is the average of 25 individual sweeps, each one recorded in response to a 50 ms-long flash applied every 30 s. The recorded 45 days-old cell is shown above records. The magenta line plots the time course of the light flash. (B) Average currents recorded from an EGFP cell (shown above sweeps) using the same experimental conditions as the cell in A. (C) Average responses to flashes delivering 356,100 photons µm−2, recorded at holding voltages of −40 and +20 mV. The horizontal dashed red lines plot the baseline levels of −56.7 and +74.8 pA at the holding potentials of −40 and +20 mV (indicated by black boxes on the left of records), respectively. Responses of different polarities are enclosed by the red box. In A, B and C experimental records were smoothed by a 100-points window to further reduce noise. (D) Average response amplitudes recorded from 5 cells in response to flashes delivering 719,500 (red) and 144,600 (blue) photons µm−2. *, p<0.05 by paired t-test. (E) Response of an adult mouse rod to a 2-ms long flash delivering 7, 18, 52, 153, 415 and 1,015 photons µm−2. Each trace was the average of 9 individual sweeps. The magenta line plots stimulus time course. (F) Fractional responses of an adult rod (green) and a RNS-derived cell (magenta) to saturating light stimuli delivering 719,500 and 1,015 photons µm−2, respectively. Traces were the average of 9 and 5 responses for the adult rod and the RNS-derived cell, respectively. (G) Fractional responses from F plotted on an expanded time scale. Temperature differences were compensated by a Q10 of 3.5.
Figure 8
Figure 8. Hyperpolarization-activated currents through Clc-2 channels in RNS-derived rods.
(A) Traces plot normalized inward currents generated by an EGFP+ cell (images of the cell are shown above) in response to a hyperpolarizing voltage step from −40 to −100 mV either in Locke solution (CNTR – black trace) or in the presence of 3 mM CsCl (CsCl - red trace). Step duration was 1.2 s. Voltages are indicated close to the traces. (B) Traces plot normalized inward currents activated in response to a hyperpolarizing voltage step from −40 to −140 mV in Locke solution (CNTR – black trace), in the presence of 2 mM CdCl2 (red trace) and after reverting to Locke solution (WASH, green trace). Step duration was 2 sec. Images of the recorded cell are shown above traces. (C–D) Sweeps plot normalized currents activated by membrane hyperpolarizations in EGFP+ RNS-derived cells at D20 (C) and D30 (D). Voltage steps ranged from −80 to −140 mV in 20 mV-steps, from a holding of −40 mV. Numbers close to the experimental records in A–D indicate the applied voltage. Vertical deflections in A–D are capacitance transients elicited by voltage changes. Calibration bars hold for both C and D. (E) Data points plot mean normalized currents, with their s.e.m., as a function of activating voltages, for D20 (red, N = 8) and D30 (green, N = 10) RNS-derived cells. For each cell the last 200 ms of the 2 s-long steps were averaged. (F) Real-time PCR evaluation of Clcn2 expression in RNS-derived cells at D20 (red), and D30 (green). Bars plot s.e.m. from a single experiment performed in triplicate. Data derive from the formula 2−ΔCt.
Figure 9
Figure 9. Effects of differentiation media on the expression of voltage-gated currents by rod-like cells derive from RNS.
(A–D) Red, green and magenta bars: time of exposure to fetal bovine serum (FBS), basic fibroblast growth factor (FGF) and sodium butyrate (NaB) and T3, respectively. Blue bars: exposure time to retinoic acid (RA) and taurine (T) for 7 (A and C) and 30 days (B and D). Time 0: beginning of treatment and corresponds to the 5th day in culture (D5). (e–h′) B/W and fluorescent images of cells cultured as shown in A (e, e′), B (f, f′), C (g, g′) and D (h, h′). (I–L) Normalized hyperpolarization-activated currents before (black – CNTR), during (red – CdCl2) and after washing out 2 mM CdCl2 (blue – WASH) by cells shown in e (I), f (J), g (K), h (L). Calibration bars in I also hold for panels J–L. (M–N) Net current densities recorded in either FBS (M, red diamonds) or FGF (N, green diamonds) with NaB/T3 plus RA/T either for 7 (red open diamonds, N = 5; green open diamonds, N = 7) or 30 (red filled diamonds, N = 4; green filled diamonds, N = 10) days. (O) Depolarization-activated fast inward currents in a D30 cells cultured in the presence of FGF and 1week treatment with RA/T/NaB/T3 (panel C). Black trace: time course of voltage steps. Color-coded numbers: voltages match noisy records. (P) Inward currents evoked by a 20 ms-long step from −140 to −20 mV were rapidly inactivated. The pre-pulse voltages are plotted by the black line above the records. (Q) Inward currents in a cell cultured as in panel A, before (black trace), during (red trace – 0 Ca) and after exposure to saline with 0-added Ca2+ (blue trace). (R) Inward currents of a cell cultured as in A before (black trace), during (red trace – CdCl2) and after exposure to 2 mM CdCl2 (blue trace - WASH).

Similar articles

Cited by

References

    1. Lamba DA, Karl MO, Ware CB, Reh TA. Efficient generation of retinal progenitor cells from human embryonic stem cells. Proc Natl Acad Sci U S A. 2006;103:12769–12774. - PMC - PubMed
    1. Lamba DA, McUsic A, Hirata RK, Wang PR, Russell D, et al. Generation, purification and transplantation of photoreceptors derived from human induced pluripotent stem cells. PLoS One. 2010;5:e8763. - PMC - PubMed
    1. Osakada F, Ikeda H, Mandai M, Wataya T, Watanabe K, et al. Toward the generation of rod and cone photoreceptors from mouse, monkey and human embryonic stem cells. Nat Biotechnol. 2008;26:215–224. - PubMed
    1. Zhao X, Liu J, Ahmad I. Differentiation of embryonic stem cells into retinal neurons. Biochem Biophys Res Commun. 2002;297:177–184. - PubMed
    1. Ahmad I, Tang L, Pham H. Identification of neural progenitors in the adult mammalian eye. Biochem Biophys Res Commun. 2000;270:517–521. - PubMed

Publication types

MeSH terms