. 2012 Jul;47(1):20-8.
doi: 10.1016/j.nbd.2012.03.020. Epub 2012 Mar 12.

Integration of GWAS SNPs and tissue specific expression profiling reveal discrete eQTLs for human traits in blood and brain

Affiliations

Integration of GWAS SNPs and tissue specific expression profiling reveal discrete eQTLs for human traits in blood and brain

Dena G Hernandez et al. Neurobiol Dis. 2012 Jul.

Abstract

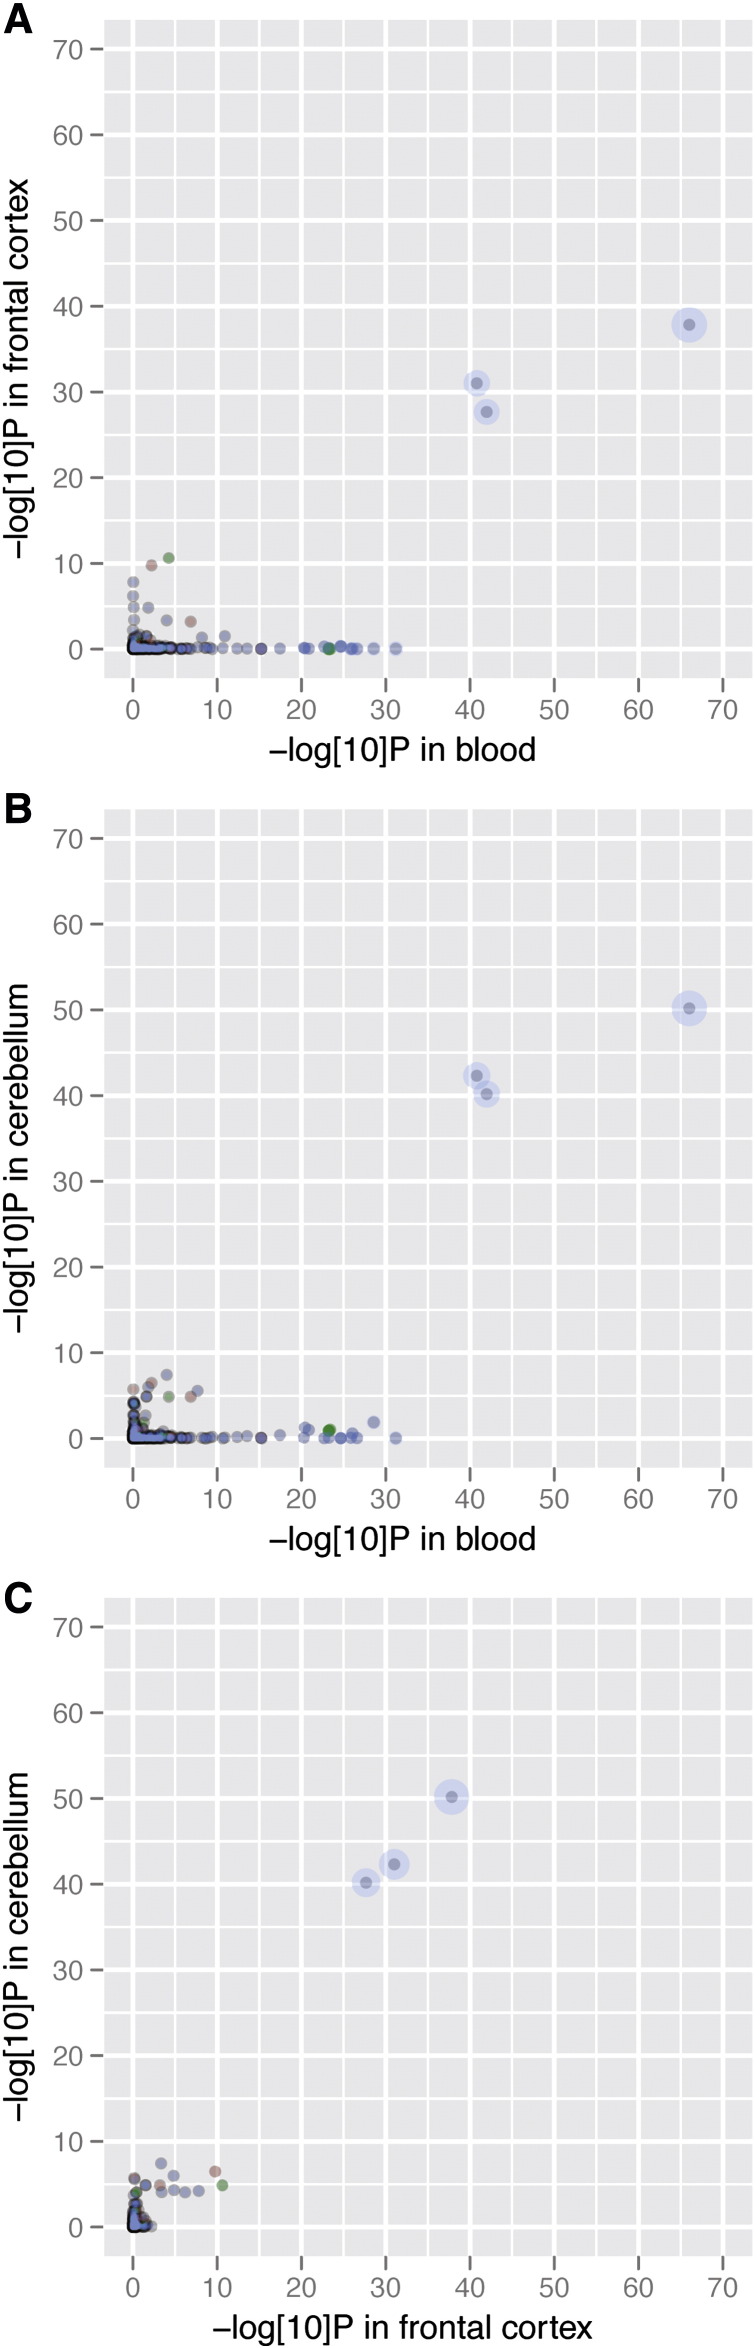
Genome-wide association studies have nominated many genetic variants for common human traits, including diseases, but in many cases the underlying biological reason for a trait association is unknown. Subsets of genetic polymorphisms show a statistical association with transcript expression levels, and have therefore been nominated as expression quantitative trait loci (eQTL). However, many tissue and cell types have specific gene expression patterns and so it is not clear how frequently eQTLs found in one tissue type will be replicated in others. In the present study we used two appropriately powered sample series to examine the genetic control of gene expression in blood and brain. We find that while many eQTLs associated with human traits are shared between these two tissues, there are also examples where blood and brain differ, either by restricted gene expression patterns in one tissue or because of differences in how genetic variants are associated with transcript levels. These observations suggest that design of eQTL mapping experiments should consider tissue of interest for the disease or other traits studied.


Figures

Fig. 1
Fig. 1
Power to detect eQTLs in brain and blood. Post-hoc power calculations were performed for sample sizes that we achieved after quality control in brain (A; 399 samples) or in blood (B; 501 samples). We estimated power (y axis) at a range of minor allele frequencies (x axis) for each sample series. Each colored line represents a different normalized effect size (Z) varying from 0.1 to 2.0 standard deviations of difference for each minor allele in an additive model. The steeper power curves for the blood series (B) indicate improved power over brain (A) to detect the same effect size, given the lower number of samples in the former series.
Fig. 2
Fig. 2
Comparative gene expression in blood and in brain. (A–C) Normalized gene expression values for each probe on the microarrays were converted to mean values across the population and ranked such that 1.0 is the highest expressed gene. Where genes were detected in < 95% of samples in the population, we set the percentile to 0. We plotted these to compare expression in blood versus frontal cortex (A) or cerebellum (B), or to compare frontal cortex and cerebellum (C). Each probe is color coded by the difference in rank between the pairs of tissue. (D–F) Similar plot but for percentile rank of the variance in expression across the population of samples for blood versus frontal cortex (D) or cerebellum (E), or frontal cortex and cerebellum (F).
Fig. 3
Fig. 3
Similar and distinct SNP:probe associations in brain and blood. Each point shows comparisons of − log[10] of FDR corrected p values for identical SNP and probe combinations across all 3 tissues investigated, comparing blood with frontal cortex (A) or cerebellum (B) and frontal cortex to cerebellum (C). Size of points is scaled to the combined FDR corrected p values after − log[10] transformation. Points are colored by the associated phenotypes, where brain traits are shown in orange, blood traits in green and others in blue.
Fig. 4
Fig. 4
Blood and brain specific eQTLs in probes that are detected in all tissues. (A) Similar locus plot for ILMN_167893, which maps to ADCY3 and reveals a highly significant signal in the brain samples but no significant p values in blood, despite adequate detection of the probe in all tissues. (B) Plot of SNPs along the Chr17 region that includes the GSDML and ORMDL3 genes showing − log[10]P values for association of each SNP with expression of Illumina probe ILMN_1666206, which maps to the GSDML gene. Despite having significant detection in all three tissues, there was a strong signal for blood (red) but not in either of cerebellum (blue) or frontal cortex (green).
Fig. 5
Fig. 5
eQTLs in probes detected only in brain or blood. (A) SNPs along the region of Chr5 that contains the LRAP gene showing − log[10]P values for association of each SNP with expression of Illumina probe ILMN_1743143. (B) Plot of SNPs along the Chr17 region that includes the MAPT gene for ILMN_ 1710903 in frontal cortex (upper panel) or cerebellum (lower panel). For each tissue, we repeated the original eQTL analysis (green) but made the analysis conditional on a proxy SNP for the H1/H2 inversion haplotype (orange). The decrease in P values after conditioning on a proxy SNP suggests that most of the signal arises from the H1/H2 haplotype.

References

    1. Barrett J.C. Genome-wide association defines more than 30 distinct susceptibility loci for Crohn's disease. Nat. Genet. 2008;40:955–962. - PMC - PubMed
    1. Barrett J.C. Genome-wide association study and meta-analysis find that over 40 loci affect risk of type 1 diabetes. Nat. Genet. 2009;41:703–707. - PMC - PubMed
    1. Bullaughey K., C. C., Coop G., Gilad Y. Expression quantitative trait loci detected in cell lines are often present in primary tissues. Hum. Mol. Genet. 2009;18:4296–4303. - PMC - PubMed
    1. Burton P.R. Genome-wide association study of 14,000 cases of seven common diseases and 3,000 shared controls. Nature. 2007;447:661–678. - PMC - PubMed
    1. Cheung V.G. Mapping determinants of human gene expression by regional and genome-wide association. Nature. 2005;437:1365–1369. - PMC - PubMed

Publication types

Associated data