Review
. 2012 Mar 21:12:98.
doi: 10.1186/1471-2407-12-98.

Patterns of regional lymph node metastasis of nasopharyngeal carcinoma: a meta-analysis of clinical evidence

Affiliations
Review

Patterns of regional lymph node metastasis of nasopharyngeal carcinoma: a meta-analysis of clinical evidence

Francis C H Ho et al. BMC Cancer. .

Abstract

Background: The characteristics of cervical lymphatic metastasis in nasopharyngeal carcinoma (NPC) are not completely understood. As such, radiotherapy to the entire lymphatic of the neck bilaterally has been empirically practiced even in early stage disease, although not supported by clinical evidence. We studied the pattern and probability of nodal metastasis through a meta-analysis of published evidences, with an aim to establish an evidence-based guideline for selecting and delineation of clinical target volume of neck lymphatics for conformation radiation for NPC.

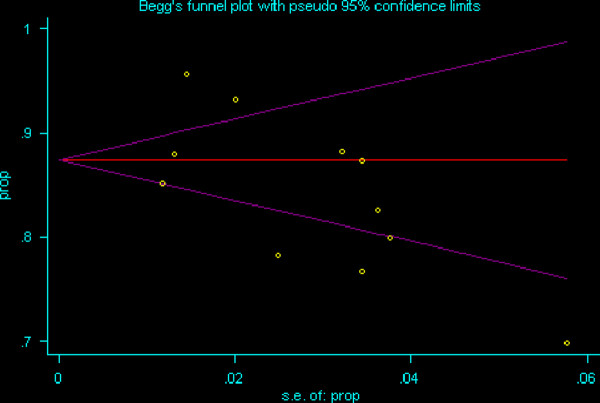
Methods: A literature search yielded an initial 411 original articles, and 13 studies with 2920 NPC cases staged via MRI were included in this analysis. The occurrence of nodal metastasis was calculated and analyzed according to the respective regional nodal levels.

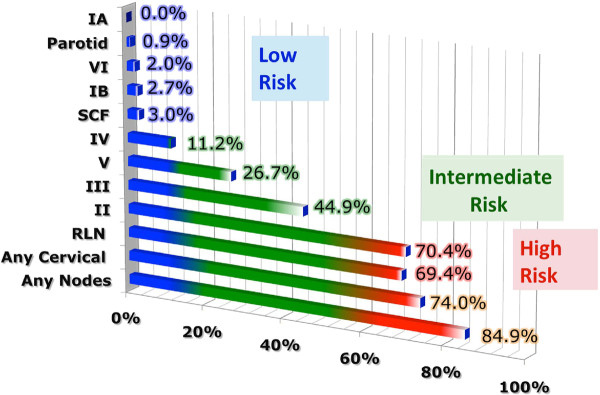
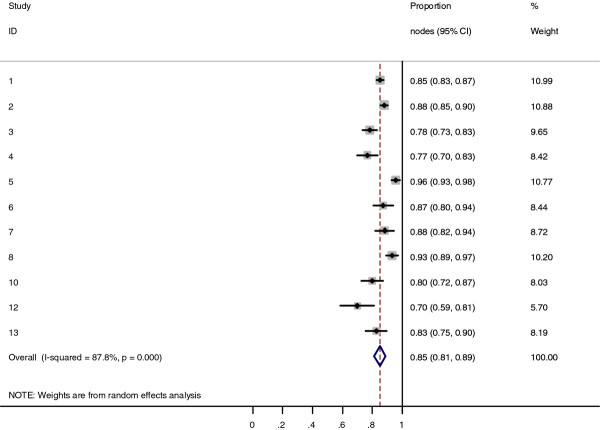
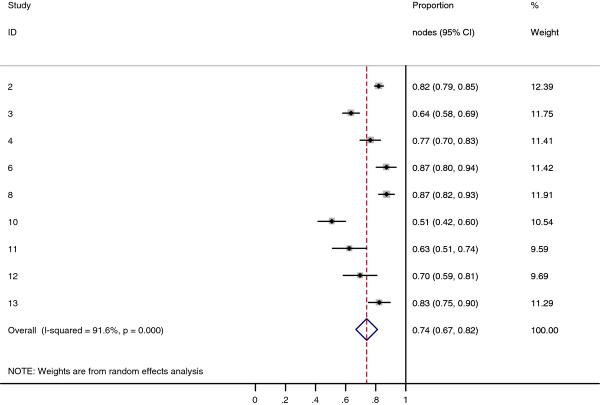
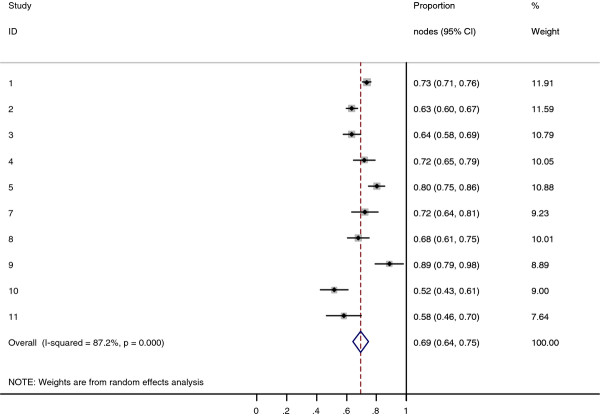
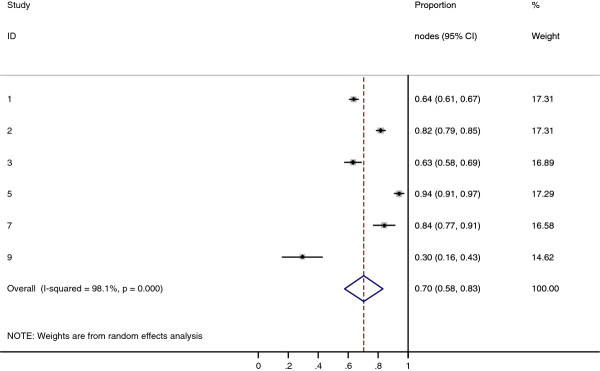
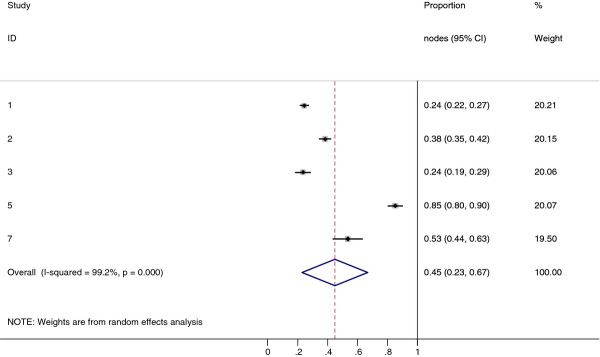
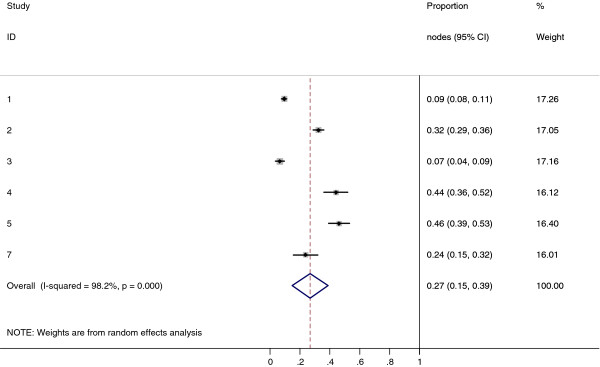
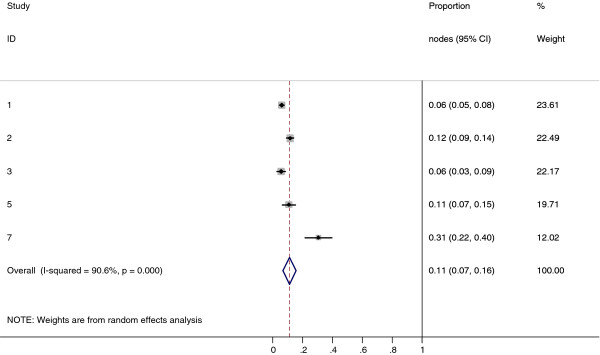
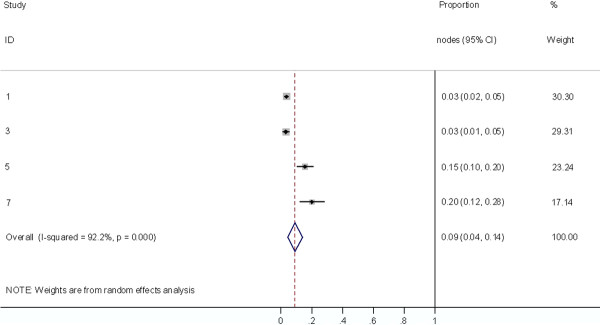
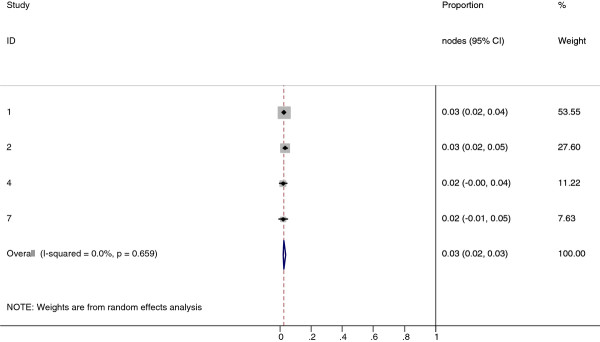
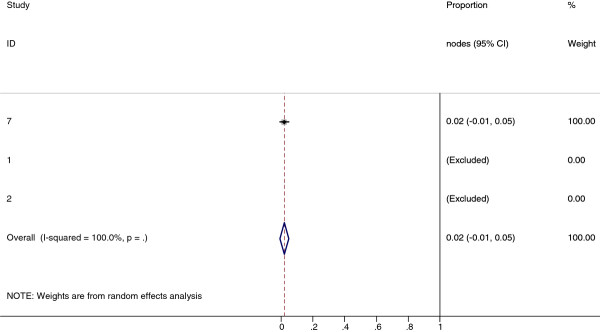
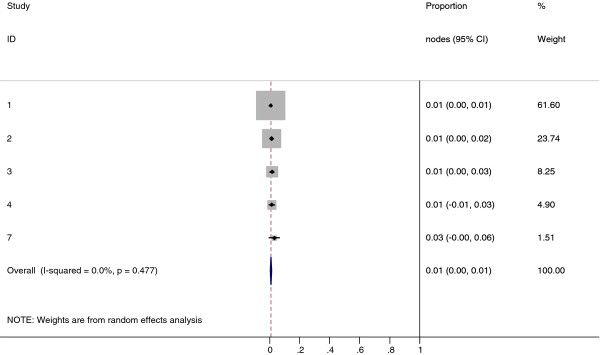
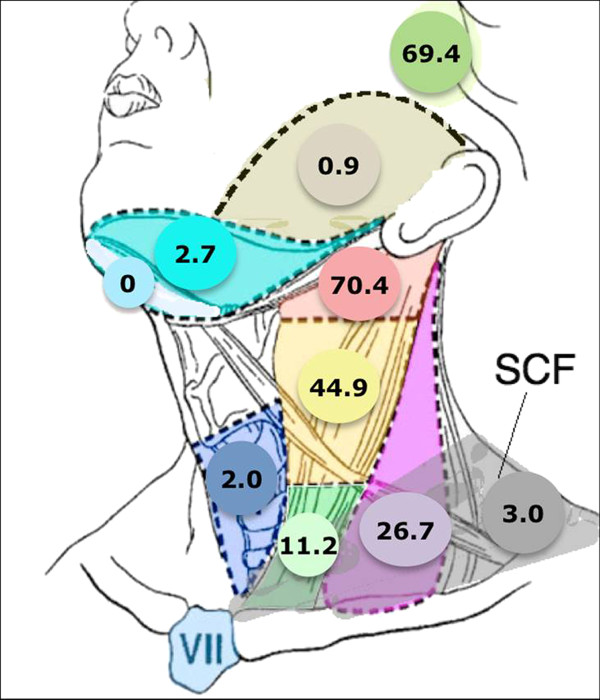
Results: 85% of NPC cases presented with lymphadenopathy. The most commonly involved regions include retropharyngeal (69%) and level II lymph nodes (70%). The overall probability of levels III, IV, and V nodal involvement are 45%, 11%, and 27%, respectively. Low-risk node groups included the supraclavicular, levels IA/IB and VI nodes, and parotid nodes with involvement rates at 3%, 0%, 3%, 0%, and 1%, respectively. Nodal metastases followed an orderly pattern and the probability of "skip" metastasis between levels varied between 0.5-7.9%.

Conclusions: Lymph node metastasis in NPC follows a predictable and orderly pattern. The rarity of metastasis in certain nodal groups and "skip" metastasis suggest that reduced treatment volume is feasible in conformal radiotherapy for NPC.


Figures

Figure 1
Figure 1
Begg's Funnel Plot assessing publication bias for the proportion of patients presenting with any LN metastasis in 11 relevant studies. Yellow dots represent the 11 relevant studies. Y axis is the proportion of patients in the particular study presenting with any lymph node metastasis. X axis is the standard error of this proportion of interest.
Figure 2
Figure 2
Graphical representation of results divided into respective lymph node echelons and risk groups. The X axis percentages represent the percentage of nodal involvement at the respective level.
Figure 3
Figure 3
Meta-analysis plot for patients with any LN metastasis. This is the forest plot generated from the 11 studies that contained relevant data. Notice study 9 and 11 are missing as these 2 studies did not contain data specifying they looked at both retropharyngeal lymph nodes and cervical lymph nodes. The 1st column specifies the study set used. The second column specified the proportion of patients that presented with lymph node metastasis in the particular study. The last column states the weightage of each study contributing to the meta-analysis. The X axis represents the proportion of patients who present with any nodal involvement.
Figure 4
Figure 4
Meta-analysis plot for patients with any cervical LN metastasis. This is the forest plot generated from the 9 studies that contained relevant data. The 1st column specifies the study set used. The second column specified the proportion of patients that presented with lymph node metastasis in the particular study. The last column states the weightage of each study contributing to the meta-analysis. The X axis represents the proportion of patients who present with any cervical LN involvement.
Figure 5
Figure 5
Meta-analysis plot for patients with RLN metastasis. This is the forest plot generated from the 10 studies that contained relevant data. The 1st column specifies the study set used. The second column specified the proportion of patients that presented with lymph node metastasis in the particular study. The last column states the weightage of each study contributing to the meta-analysis. The X axis represents the proportion of patients who present with any RLN involvement.
Figure 6
Figure 6
Meta-analysis plot for patients with Level II cervical LN metastasis. This is the forest plot generated from the 6 studies that contained relevant data. The 1st column specifies the study set used. The second column specified the proportion of patients that presented with lymph node metastasis in the particular study. The last column states the weightage of each study contributing to the meta-analysis. The X axis represents the proportion of patients who present with any Level II cervical involvement.
Figure 7
Figure 7
Meta-analysis plot for patients with Level III cervical LN metastasis. This is the forest plot generated from the 5 studies that contained relevant data. The 1st column specifies the study set used. The second column specified the proportion of patients that presented with lymph node metastasis in the particular study. The last column states the weightage of each study contributing to the meta-analysis. The X axis represents the proportion of patients who present with any Level III cervical involvement.
Figure 8
Figure 8
Meta-analysis plot for patients with Level V cervical LN metastasis. This is the forest plot generated from the 6 studies that contained relevant data. The 1st column specifies the study set used. The second column specified the proportion of patients that presented with lymph node metastasis in the particular study. The last column states the weightage of each study contributing to the meta-analysis. The X axis represents the proportion of patients who present with any Level V cervical involvement.
Figure 9
Figure 9
Meta-analysis plot for patients with Level IV cervical LN metastasis. This is the forest plot generated from the 5 studies that contained relevant data. The 1st column specifies the study set used. The second column specified the proportion of patients that presented with lymph node metastasis in the particular study. The last column states the weightage of each study contributing to the meta-analysis. The X axis represents the proportion of patients who present with any Level IV cervical involvement.
Figure 10
Figure 10
Meta-analysis plot for patients with SCF LN metastasis. This is the forest plot generated from the 4 studies that contained relevant data. The 1st column specifies the study set used. The second column specified the proportion of patients that presented with lymph node metastasis in the particular study. The last column states the weightage of each study contributing to the meta-analysis. The X axis represents the proportion of patients who present with any SCF LN involvement.
Figure 11
Figure 11
Meta-analysis plot for patients with Level IB cervical LN metastasis. This is the forest plot generated from the 4 studies that contained relevant data. The 1st column specifies the study set used. The second column specified the proportion of patients that presented with lymph node metastasis in the particular study. The last column states the weightage of each study contributing to the meta-analysis. The X axis represents the proportion of patients who present with any Level IB cervical involvement.
Figure 12
Figure 12
Meta-analysis plot for patients with Level VI cervical LN metastasis. This is the forest plot generated from the 3 studies that contained relevant data. The 1st column specifies the study set used. The second column specified the proportion of patients that presented with lymph node metastasis in the particular study. The last column states the weightage of each study contributing to the meta-analysis. The X axis represents the proportion of patients who present with any Level VI cervical involvement.
Figure 13
Figure 13
Meta-analysis plot for patients with parotid LN metastasis. This is the forest plot generated from the 5 studies that contained relevant data. The 1st column specifies the study set used. The second column specified the proportion of patients that presented with lymph node metastasis in the particular study. The last column states the weightage of each study contributing to the meta-analysis. The X axis represents the proportion of patients who present with any parotid LN involvement.
Figure 14
Figure 14
Pictorial summary of incidence of LN metastasis in NPC. This is a pictorial representation of the neck. The respective numbers represent the overall percentage of NPC patients presenting with positive LN metastasis at the particular nodal station.

Similar articles

Cited by

References

    1. Parkin WS DM, Ferlay RL J, Young J. Cancer Incidence in Five Continents, Vol 7. Vol. 7. Lyon: IARC Press; 1997.
    1. Sham JS, Choy D, Wei WI. Nasopharyngeal carcinoma: orderly neck node spread. Int J Radiat Oncol Biol Phys. 1990;19(4):929–933. doi: 10.1016/0360-3016(90)90014-B. - DOI - PubMed
    1. Lee AW, Sham JS, Poon YF, Ho JH. Treatment of stage I nasopharyngeal carcinoma: analysis of the patterns of relapse and the results of withholding elective neck irradiation. Int J Radiat Oncol Biol Phys. 1989;17(6):1183–1190. doi: 10.1016/0360-3016(89)90524-5. - DOI - PubMed
    1. CA P. Principles and Practice of Radiation Oncolog. 3. Philadelphia: JB Lippincott; 1998. Nasopharynx.
    1. Lee AW, Ng WT, Hung WM, Choi CW, Tung R, Ling YH, Cheng PT, Yau TK, Chang AT, Leung SK. et al.Major late toxicities after conformal radiotherapy for nasopharyngeal carcinoma-patient- and treatment-related risk factors. Int J Radiat Oncol Biol Phys. 2009;73(4):1121–1128. doi: 10.1016/j.ijrobp.2008.05.023. - DOI - PubMed