Review
. 2011 Dec;84 Spec No 2(Spec Iss 2):S179-95.
doi: 10.1259/bjr/76389842.

Specific biomarkers of receptors, pathways of inhibition and targeted therapies: clinical applications

Affiliations
Review

Specific biomarkers of receptors, pathways of inhibition and targeted therapies: clinical applications

Y Waerzeggers et al. Br J Radiol. 2011 Dec.

Abstract

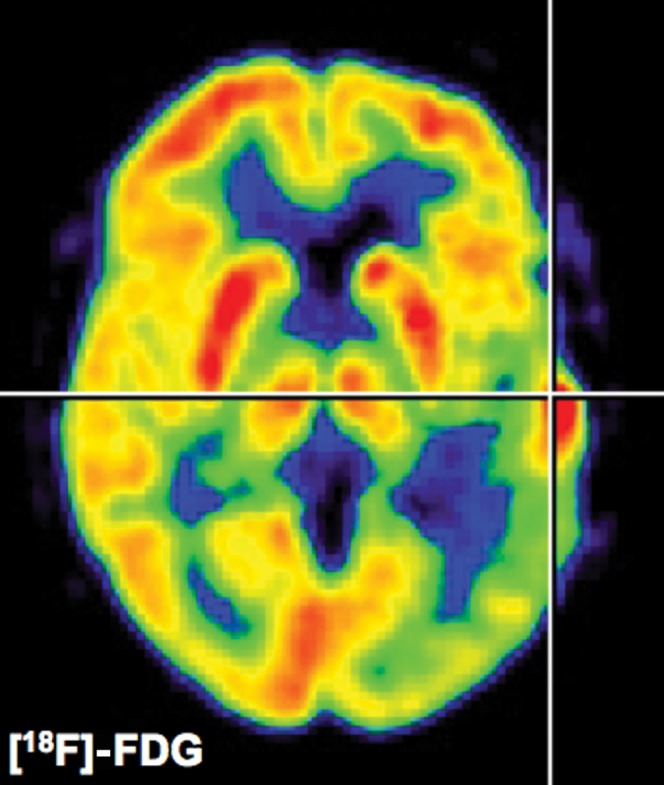
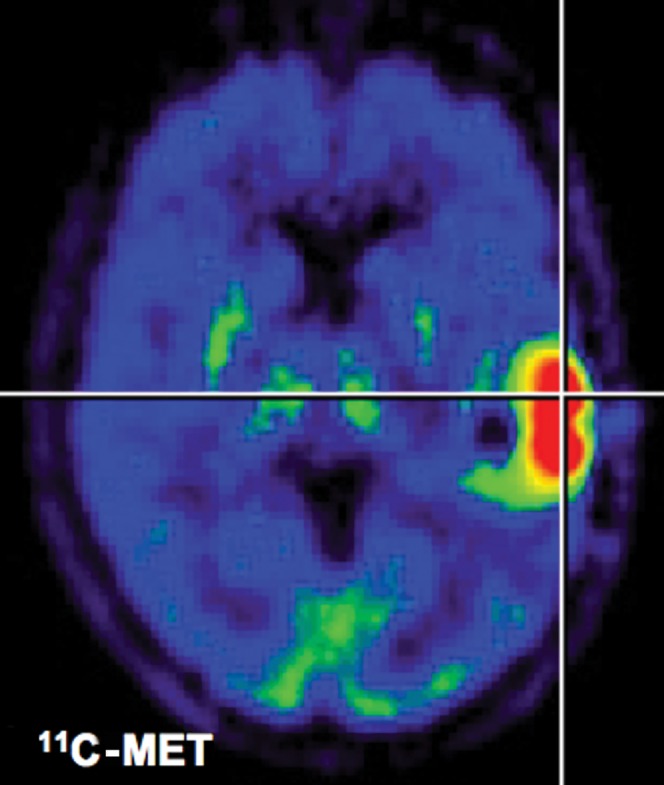
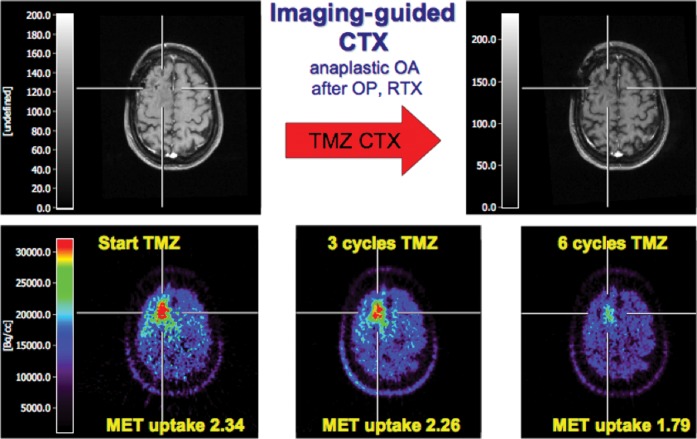
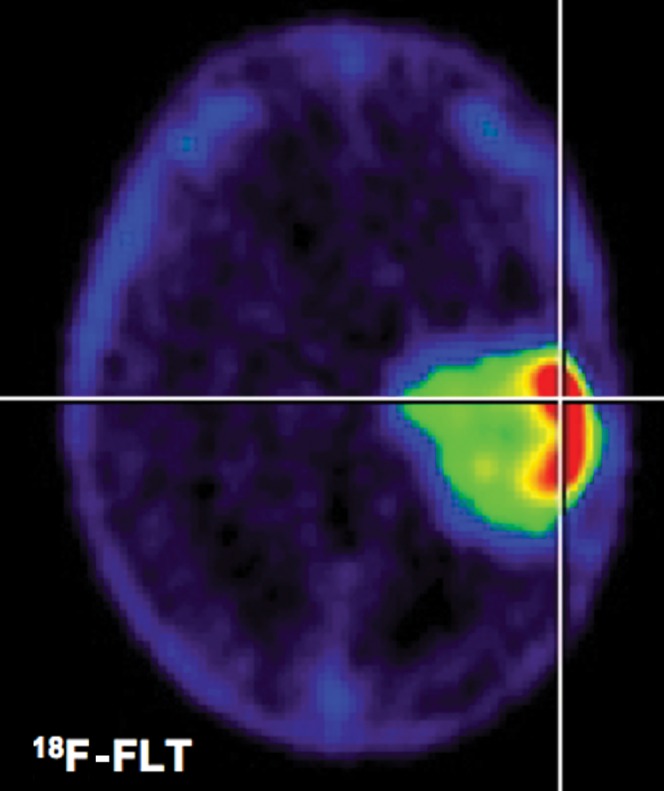
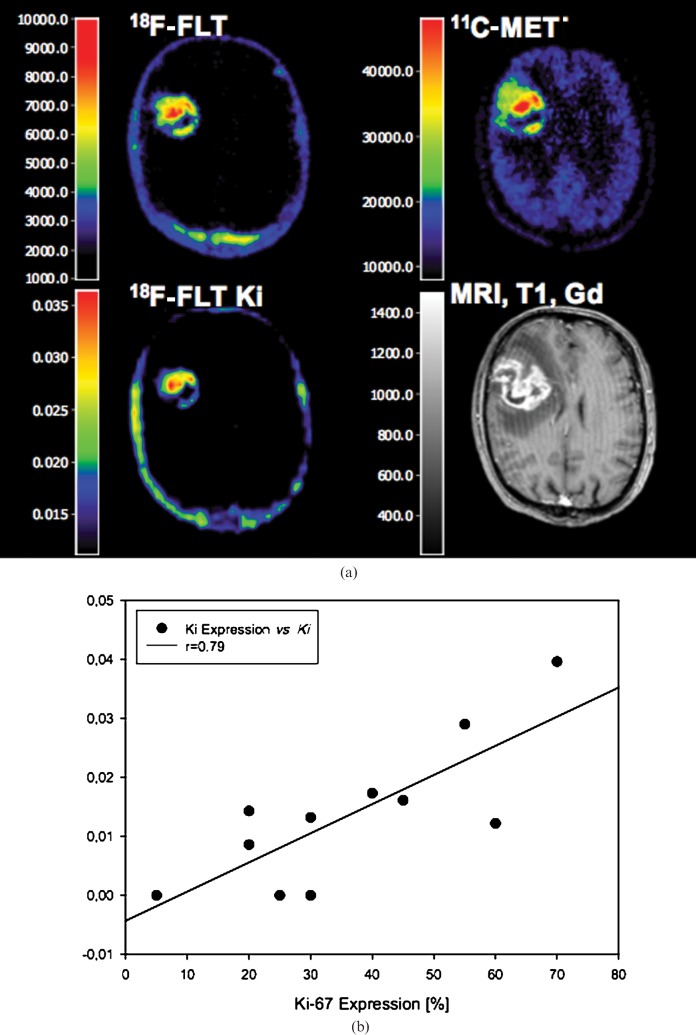
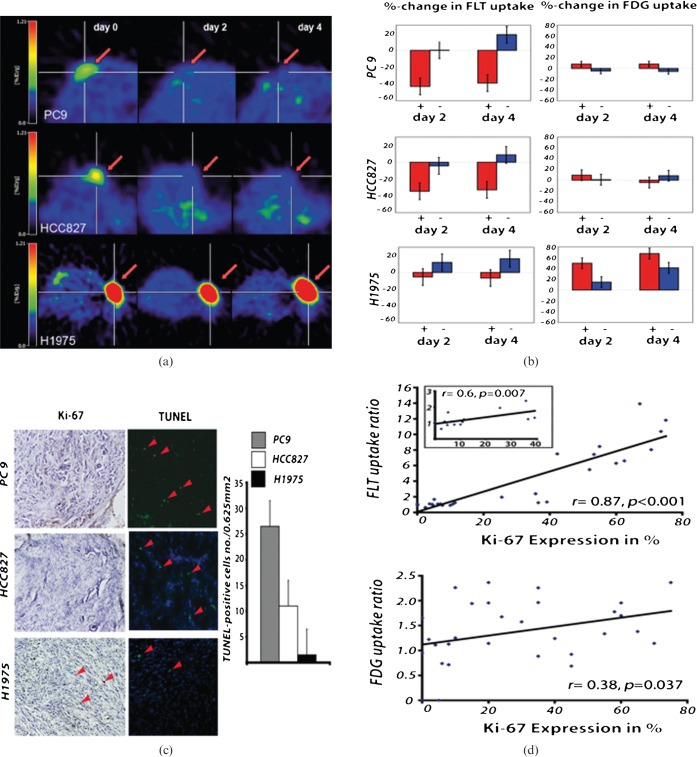
A deeper understanding of the role of specific genes, proteins, pathways and networks in health and disease, coupled with the development of technologies to assay these molecules and pathways in patients, promises to revolutionise the practice of clinical medicine. In particular, the discovery and development of novel drugs targeted to disease-specific alterations could benefit significantly from non-invasive imaging techniques assessing the dynamics of specific disease-related parameters. Here we review the application of imaging biomarkers in the management of patients with brain tumours, especially malignant glioma. This first part of the review focuses on imaging biomarkers of general biochemical and physiological processes related to tumour growth such as energy, protein, DNA and membrane metabolism, vascular function, hypoxia and cell death. These imaging biomarkers are an integral part of current clinical practice in the management of primary brain tumours. The second article of the review discusses the use of imaging biomarkers of specific disease-related molecular genetic alterations such as apoptosis, angiogenesis, cell membrane receptors and signalling pathways. Current applications of these biomarkers are mostly confined to experimental small animal research to develop and validate these novel imaging strategies with future extrapolation in the clinical setting as the primary objective.


Figures

Figure 1
Figure 1
18F-fluorodeoxyglucose (FDG) positron emission tomography. Glucose metabolism can be determined quantitatively (μmol 100 g–1 min–1) in patients with gliomas. Low-grade gliomas will show a decreased glucose metabolism whereas high-grade gliomas as depicted in this figure will show an increased uptake of 18F-FDG which is proportional to the cellular density of the glioma. It should be pointed out that the extent of secondary inactivation of normal grey matter as depicted in this patient is of prognostic relevance. Because of high cortical background activity and glucose consumption in normal brain, improved glioma radiotracers with lower background activity in normal brain as shown in Figures 2 and 4 have been developed.
Figure 2
Figure 2
11C-methionine positron emission tomography (PET). After application of radiolabelled amino acids, they are transported through endothelial cells into the tumour. Background uptake in brain is limited, enabling the delineation of the glioma. This is a clear advantage over 18F-fluorodeoxyglucose PET. Owing to metabolisation of methionine, quantification of uptake is only possible in a semi-quantitative manner (tumour-to-background ratios).
Figure 3
Figure 3
11C-methionine positron emission tomography (MET-PET) for imaging-guided chemotherapy. A patient with an anaplastic oligoastrocytoma after resection and radiation therapy presented with increased seizure activity as sign of tumour recurrence. Based on MRI (upper left) a clear indication of active tumour could not be found. 11C-MET-PET identified recurrent tumour (lower left). The patient was put on temozolomide treatment. Follow-up 11C-MET-PET could identify positive temozolomide (TMZ) response (lower row) whereas MRI did not show a clear change over time (upper right) (modified from Galldiks et al [63] with permission). CTX, chemotherapy; OA, oligoastrocytoma; OP, operation; RTX, radiotherapy.
Figure 4
Figure 4
3′-deoxy-3′-fluorothymidine positron emission tomography (FLT-PET). After systemic administration of 18F-FLT, it accumulates in brain tumours according to World Health Organization grade. Background uptake in normal brain is lowest compared with 18F-Fluorodeoxyglucose (FDG)- and 11C-methionine (MET)-PET. Kinetic analysis seems necessary to determine proliferative activity and to distinguish 18F-FLT uptake due to leakage of the blood–brain barrier (see Figure 5).
Figure 5
Figure 5
Parametric mapping of 18F-3′-deoxy-3′-fluorothymidine (FLT) Ki (a) and correlation to Ki-67 (b). (a) Coregistered 18F-FLT positron emission tomography (PET), 11C-methionine (MET)-PET, parametric map of 18F-FLT Ki and MRI (T1+Gd) in a 63-year-old patient with a first diagnosed glioblastoma multiforme. 18F-FLT- and 11C-MET-PET images show high tracer uptake ratios (18F-FLT, 6.7-fold; 11C-MET, 3.2-fold) than the contralateral tissue, parametric 18F-FLT mapping shows an increased kinetic metabolic rate constant Ki (0.0161 ml g–1 min–1) which is related to a high percentage Ki-67 expression (45%). (b) The relationship between 18F-FLT Ki and Ki-67 expression in 11 patients with newly diagnosed glioma (modified from Ullrich et al [79] with permission).
Figure 6
Figure 6
Multitracer positron emission tomography (PET) evaluation of epidermal growth factor receptor (EGFR) tyrosine kinase inhibitor (TKI) treatment. 18F-3′-deoxy-3′-fluorothymidine (FLT) PET indicates response to therapy after 2 days of erlotinib treatment (50 mg kg–1) in the EGFR TKI-sensitive non-small cell lung cancer xenografts PC9 (n=8; vehicle, n=2) and HCC827 (n=7; vehicle, n=2) (a). The PET signal remains reduced also after 4 days of erlotinib treatment. No significant decrease in 18F-FLT uptake was observed in the EGFR TKI-resistant H1975 xenografts (n=8; vehicle, n=2). Statistical analysis revealed a significant reduction in 18F-FLT uptake in HCC827 and PC9 xenografts (b) and no significant changes in the H1975 xenografts during therapy. 18F-FDG metabolism only slightly decreased after 4 days of erlotinib treatment in the HCC827 xenografts. However, even after 4 days of erlotinib treatment the reduction in 18F-FDG uptake was not significant. The decrease in 18F-FLT uptake was accompanied by inhibition of cell growth as assessed by Ki-67 staining (c). The strong correlation between 18F-FLT uptake and the in vitro proliferation marker Ki-67 highlights the ability of 18F-FLT to assess cell proliferation in vivo (r=0.87, p<0.001). In contrast, the correlation of Ki-67 expression to 18F-FDG uptake was much lower (r=0.38, p=0.0037) (d) (modified from Ullrich et al 2008 with permission [82]).

References

    1. Neves AA, Brindle KM. Assessing responses to cancer therapy using molecular imaging. Biochim Biophys Acta 2006;1766:242–61 - PubMed
    1. Harrington DP. Imaging biomarkers and the future of radiology. J Am Coll Radiol 2006;3:317–18 - PubMed
    1. Miller AB, Hoogstraten B, Staquet M, Winkler A. Reporting results of cancer treatment. Cancer 1981;47:207–14 - PubMed
    1. Therasse P, Arbuck SG, Eisenhauer EA, Wanders J, Kaplan RS, Rubinstein L, et al. New guidelines to evaluate the response to treatment in solid tumors. European Organization for Research and Treatment of Cancer, National Cancer Institute of the United States, National Cancer Institute of Canada. J Natl Cancer Inst 2000;92:205–16 - PubMed
    1. Macdonald DR, Cascino TL, Schold SC., Jr , Cairncross JG. Response criteria for phase II studies of supratentorial malignant glioma. J Clin Oncol 1990;8:1277–80 - PubMed

Publication types

MeSH terms

Substances