Review
. 2011 Dec;84 Spec No 2(Spec Iss 2):S90-106.
doi: 10.1259/bjr/23430927.

Biology, genetics and imaging of glial cell tumours

Affiliations
Review

Biology, genetics and imaging of glial cell tumours

C Walker et al. Br J Radiol. 2011 Dec.

Abstract

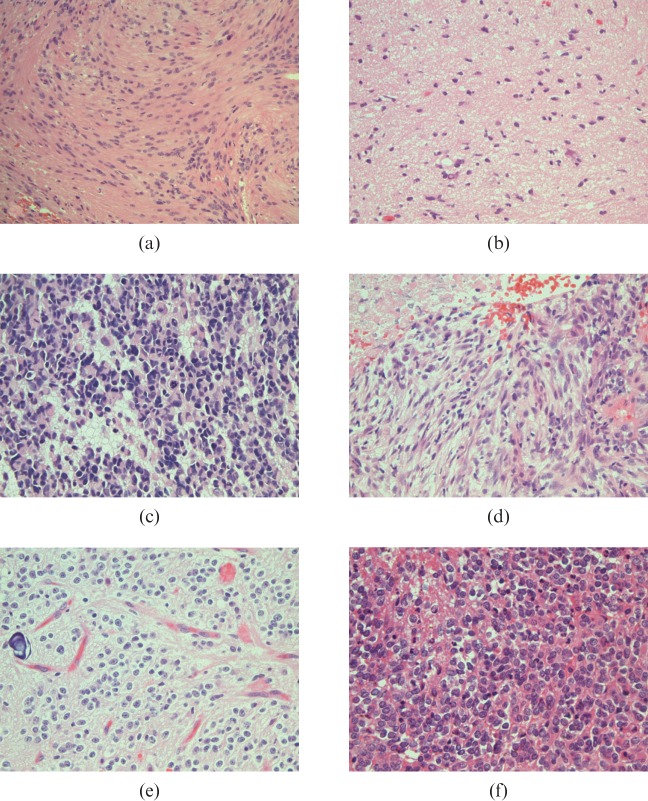
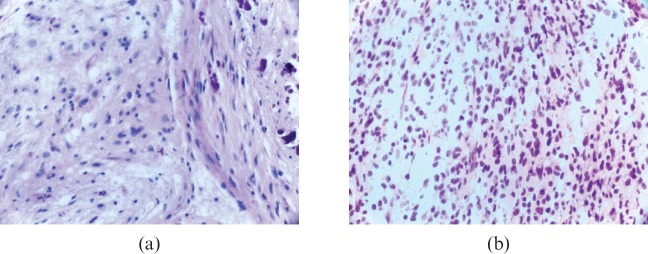
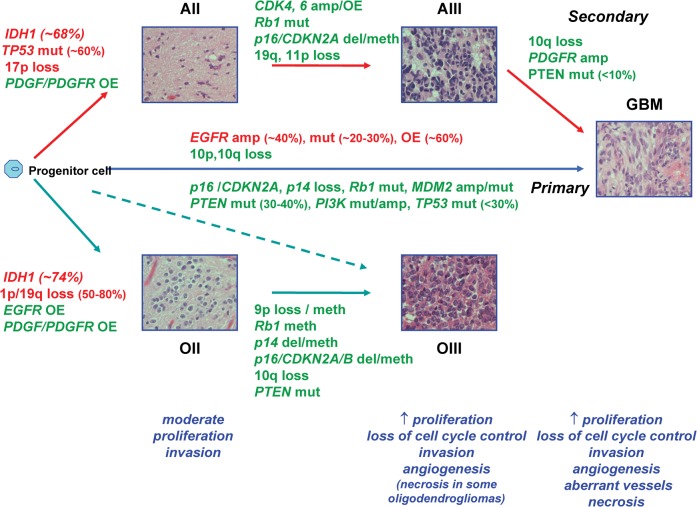
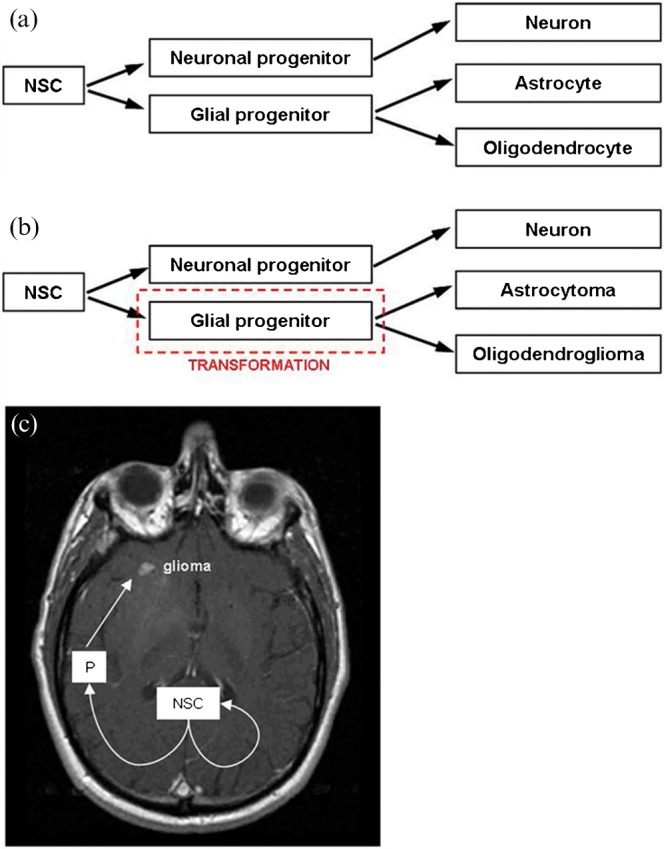
Despite advances in therapy, gliomas remain associated with poor prognosis. Clinical advances will be achieved through molecularly targeted biological therapies, for which knowledge of molecular genetic and gene expression characteristics in relation to histopathology and in vivo imaging are essential. Recent research supports the molecular classification of gliomas based on genetic alterations or gene expression profiles, and imaging data supports the concept that molecular subtypes of glioma may be distinguished through non-invasive anatomical, physiological and metabolic imaging techniques, suggesting differences in the baseline biology of genetic subtypes of infiltrating glioma. Furthermore, MRI signatures are now being associated with complex gene expression profiles and cellular signalling pathways through genome-wide microarray studies using samples obtained by image guidance which may be co-registered with clinical imaging. In this review we describe the pathobiology, molecular pathogenesis, stem cells and imaging characteristics of gliomas with emphasis on astrocytomas and oligodendroglial neoplasms.


Figures

Figure 1
Figure 1
World Health Organization (WHO) histopathology classification of gliomas. (a) Pilocytic astrocytoma WHO grade I, with compact bundles of "piloid"/elongated cells containing nuclei with minimal atypia; (b) astrocytoma WHO grade II, showing increased cellularity with occasional atypical nuclei and some cells with enlarged cytoplasm; (c) astrocytoma WHO grade III, containing darkly stained nuclei with increased cytoplasm and occasional mitoses; (d) glioblastoma WHO grade IV, illustrating tumour necrosis without pseudopalisading as is commonly seen in glioblastomas; (e) oligodendroglioma WHO grade II, showing perinuclear haloes, "chickenwire" vasculature and microcalcification; (f) oligodendroglioma WHO grade III, with increased cellularity retaining roundness of nuclei associated with cell necrosis, note the mild infiltration by neutrophils.
Figure 2
Figure 2
Oligoastrocytomas. (a) Oligoastrocytoma World Health Organization (WHO) grade II showing a moderately cellular glioma composed of an oligodendroglial (left aspect) and an astrocytic component (right aspect) with calcification. (b) Oligoastrocytoma WHO grade III showing densely packed diffuse oligodendroglial and astrocytic cells with scattered mitoses.
Figure 3
Figure 3
Molecular pathogenesis of adult astrocytic and oligodendroglial neoplasms. The illustration shows the progression of low-grade astrocytomas and oligodendrogliomas to higher grade with sequential accumulation of genetic alterations and impact on the biological properties of these tumours. Genetic alterations seen in lower grade tumours are retained on progression. Anaplastic oligodendrogliomas may arise through progression or de novo, but irrespective of route have similar clinical behaviour and molecular genetic characteristics with 1p/19q loss as their genetic hallmark. Glioblastomas arise de novo or progress from lower grade astrocytomas. Although indistinguishable clinically, they may be separated by their spectrum of genetic alterations, but these genetic alterations are not mutually exclusive to either lineage. The most common genetic alterations used to distinguish molecular subtypes of glioma are shown in red. AII, astrocytoma WHO grade II; AIII, astrocytoma WHO grade III; amp, amplification; del, deletion; GBM, glioblastoma WHO grade IV; meth, methylation; mut, mutation; OII, oligodendroglioma WHO grade II; OIII, oligodendroglioma WHO grade III. OE, overexpression.
Figure 4
Figure 4
Neural stem cell and progenitor cell theory of glioma development. (a) normal cell development. (b) astrocytoma, oligodendroglioma and other glioma subtype development may follow neoplastic transformation of a glial progenitor cell resulting in neoplastic cells that phenotypically resemble normal cells. (c) asymmetrical division of neural stem cell results in a cell population, which remains at the germinal origin, and a progenitor cell population, which migrates and proliferates causing distant glioma (adapted from Sanai et al [121] and Berger et al [127]). NSC, neural stem cell; P, progenitor cell.
Figure 5
Figure 5
Multimodal imaging characteristics of oligodendroglial tumours classified by genotype. (a, b) T2 weighted MRI. (c, d) Negative enhancement integral colour maps used to derive relative cerebral blood volume (rCBV). (e, f) Apparent diffusion coefficient (ADC) maps. The left panel shows 1p/19q loss tumours exhibiting indistinct, (a) irregular T2 border, (c) high rCBV and (e) low histogram ADC. The right panel shows 1p/19q intact tumours displaying sharp, (b) smooth T2 border, (d) low rCBV and (f) high histogram ADC.
Figure 6
Figure 6
Analysis of image texture in relation to genotype. (a, b) T2 and fluid-attenuated inversion-recovery weighted images of an oligodendroglioma with loss of 1p and 19q and (c, d) an oligodendroglioma with intact 1p and 19q. The similar-looking images were correctly classified with regard to genotype using texture analysis. Images are cropped to 128 × 128 pixels (green) before being transformed; ROIs are as indicated (pink). Reproduced with permission from Brown et al. [159].
Figure 7
Figure 7
Border sharpness coefficient (BSC) in glioblastomas. The tumour shown in (a) had the largest T2 BSC, signifying a sharp T2 bright border, and proved to be non- epidermal growth factor receptor (EGFR)-amplified, whereas the tumour in (b) had the smallest T2 BSC, signifying a fuzzy T2 bright border, and proved to be EGFR-amplified Reproduced with permission from Aghi et al. [180].
Figure 8
Figure 8
Gene expression surrogates for MRI traits. (a) Association between the hypoxia gene expression module and contrast enhancement. Tumour arrays were clustered by using only cDNA clones contained within the gene module. The value of the imaging trait for each tumour is indicated by the coloured box above the expression map. Representative MRI are depicted on the left and a subset of named genes is labelled. (b) expanded view of the association between the proliferation gene-expression module and mass effect. Reproduced with permission from Diehn et al [13].

References

    1. Burnet NG, Jefferies SJ, Benson RJ, Hunt DP, Treasure FP. Years of life lost (YLL) from cancer is an important measure of population burden—and should be considered when allocating research funds. Br J Cancer 2005;92:241–5 - PMC - PubMed
    1. Stupp R, Hegi ME, van denBent MJ, Mason WP, Weller M, Mirimanoff RO, et al. Changing paradigms—an update on the multidisciplinary management of malignant glioma. Oncologist 2006;11:165–80 - PubMed
    1. Colman H, Aldape K. Molecular predictors in glioblastoma: toward personalized therapy. Arch Neurol 2008;65:877–83 - PubMed
    1. Louis DN. Molecular pathology of malignant gliomas. Annu Rev Pathol 2006;1:97–117 - PubMed
    1. Collins VP. Mechanisms of disease: genetic predictors of response to treatment in brain tumors. Nat Clin Pract Oncol 2007;4:362–74 - PubMed