

On the comparison of population-level estimates of haplotype and nucleotide diversity: a case study using the gene cox1 in animals
- PMID: 22434013
- PMCID: PMC3375404
- DOI: 10.1038/hdy.2012.12
On the comparison of population-level estimates of haplotype and nucleotide diversity: a case study using the gene cox1 in animals
Abstract
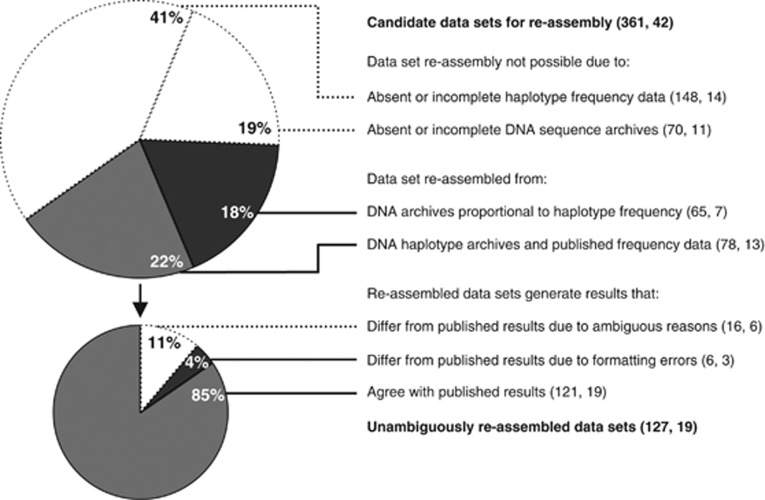
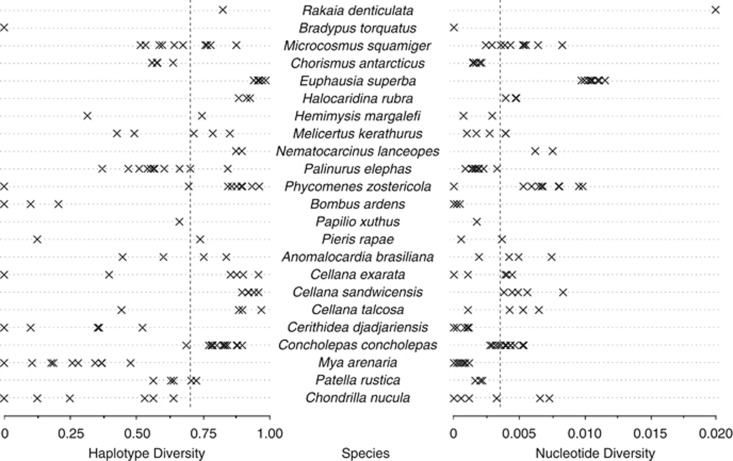
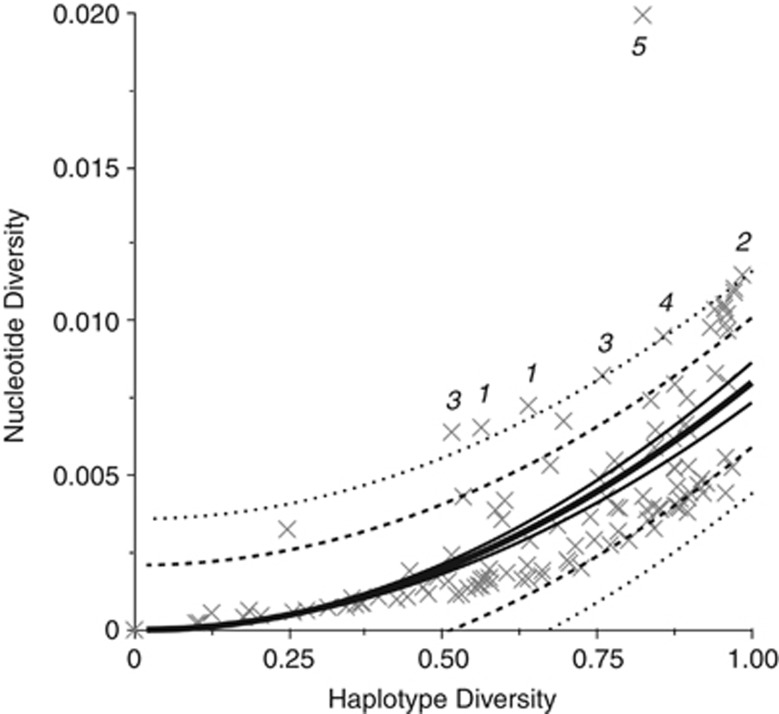
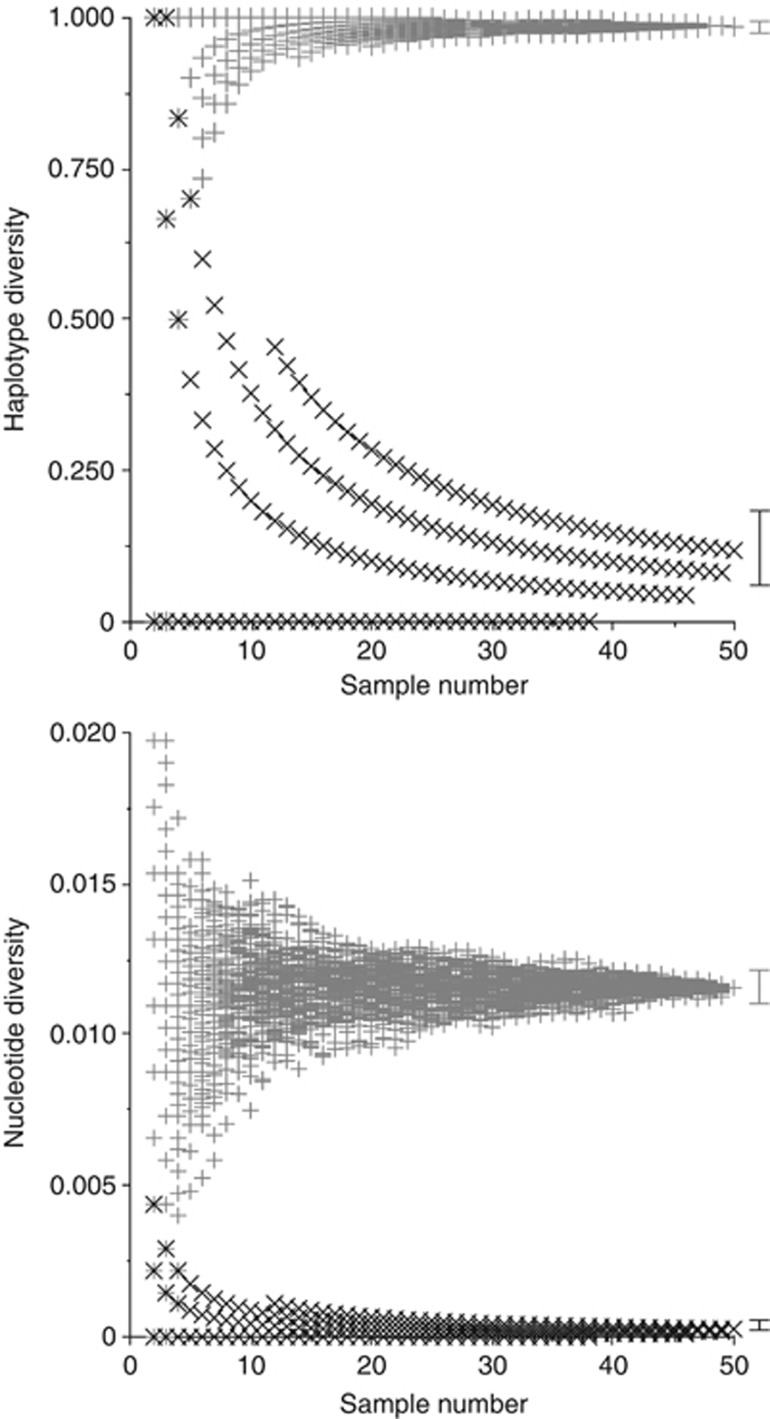
Estimates of genetic diversity represent a valuable resource for biodiversity assessments and are increasingly used to guide conservation and management programs. The most commonly reported estimates of DNA sequence diversity in animal populations are haplotype diversity (h) and nucleotide diversity (π) for the mitochondrial gene cytochrome c oxidase subunit I (cox1). However, several issues relevant to the comparison of h and π within and between studies remain to be assessed. We used population-level cox1 data from peer-reviewed publications to quantify the extent to which data sets can be re-assembled, to provide a standardized summary of h and π estimates, to explore the relationship between these metrics and to assess their sensitivity to under-sampling. Only 19 out of 42 selected publications had archived data that could be unambiguously re-assembled; this comprised 127 population-level data sets (n ≥ 15) from 23 animal species. Estimates of h and π were calculated using a 456-base region of cox1 that was common to all the data sets (median h=0.70130, median π=0.00356). Non-linear regression methods and Bayesian information criterion analysis revealed that the most parsimonious model describing the relationship between the estimates of h and π was π=0.0081 h(2). Deviations from this model can be used to detect outliers due to biological processes or methodological issues. Subsampling analyses indicated that samples of n>5 were sufficient to discriminate extremes of high from low population-level cox1 diversity, but samples of n ≥ 25 are recommended for greater accuracy.
Figures
Similar articles
-
Genetic analysis of Bactrocera zonata (Diptera: Tephritidae) populations from India based on cox1 and nad1 gene sequences.Mitochondrial DNA A DNA Mapp Seq Anal. 2018 Jul;29(5):727-736. doi: 10.1080/24701394.2017.1350952. Epub 2017 Jul 15. Mitochondrial DNA A DNA Mapp Seq Anal. 2018. PMID: 28712341
-
Preliminary information on the prevalence and molecular description of Taenia hydatigena isolates in Pakistan based on mitochondrial cox1 gene.Infect Genet Evol. 2020 Nov;85:104481. doi: 10.1016/j.meegid.2020.104481. Epub 2020 Jul 28. Infect Genet Evol. 2020. PMID: 32736043
-
Genetic analysis of oriental fruit fly, Bactrocera dorsalis (Diptera: Tephritidae) populations based on mitochondrial cox1 and nad1 gene sequences from India and other Asian countries.Genetica. 2016 Oct;144(5):611-623. doi: 10.1007/s10709-016-9929-7. Epub 2016 Oct 3. Genetica. 2016. PMID: 27699519
-
Analysis of the cytochrome c oxidase subunit 1 (COX1) gene reveals the unique evolution of the giant panda.Gene. 2016 Nov 5;592(2):303-7. doi: 10.1016/j.gene.2016.07.029. Epub 2016 Jul 13. Gene. 2016. PMID: 27421668
-
Assessment of the global pattern of genetic diversity in Echinococcus multilocularis inferred by mitochondrial DNA sequences.Vet Parasitol. 2018 Oct 15;262:30-41. doi: 10.1016/j.vetpar.2018.09.013. Epub 2018 Sep 27. Vet Parasitol. 2018. PMID: 30389009 Review.
Cited by
-
Phylogeographic Structure and Population Dynamics of Baoxing Osmanthus (Osmanthus serrulatus), an Endemic Species from the Southwest Sichuan Basin, China.Plants (Basel). 2024 Jun 14;13(12):1653. doi: 10.3390/plants13121653. Plants (Basel). 2024. PMID: 38931085 Free PMC article.
-
Natural and Artificial Selection for Parasitoid Resistance in Drosophila melanogaster Leave Different Genetic Signatures.Front Genet. 2019 May 31;10:479. doi: 10.3389/fgene.2019.00479. eCollection 2019. Front Genet. 2019. PMID: 31214243 Free PMC article.
-
Genetic diversity and genome-scale population structure of wild Indian major carp, Labeo catla (Hamilton, 1822), revealed by genotyping-by-sequencing.Front Genet. 2023 May 9;14:1166385. doi: 10.3389/fgene.2023.1166385. eCollection 2023. Front Genet. 2023. PMID: 37229204 Free PMC article.
-
Phylogeography of Bulinus truncatus (Audouin, 1827) (Gastropoda: Planorbidae) in Selected African Countries.Trop Med Infect Dis. 2018 Dec 19;3(4):127. doi: 10.3390/tropicalmed3040127. Trop Med Infect Dis. 2018. PMID: 30572694 Free PMC article.
-
Nuclear and Chloroplast Markers Provide New Insights Into the Syngameon Dynamics of Genus Micromeria (Lamiaceae) in the Canary Islands.Ecol Evol. 2025 Aug 2;15(8):e71843. doi: 10.1002/ece3.71843. eCollection 2025 Aug. Ecol Evol. 2025. PMID: 40755893 Free PMC article.
References
-
- Bazin E, Glémin S, Galtier N. Population size does not influence mitochondrial genetic diversity in animals. Science. 2006;312:570–572. - PubMed
-
- Bucklin A, Steinke D, Blanco-Bercial L. DNA Barcoding of Marine Metazoa. Annu Rev Mar Sci. 2011;3:471–508. - PubMed
-
- Burnham KP, Anderson DR. Model Selection and Multimodel Inference: A Practical Information-Theoretic Approach. Springer: New York; 2002.
-
- Bird CE, Holland BS, Bowen BW, Toonen RJ. Contrasting phylogeography in three endemic Hawaiian limpets (Cellana spp.) with similar life histories. Mol Ecol. 2007;16:3173–3186. - PubMed
Publication types
MeSH terms
Substances
LinkOut - more resources
Full Text Sources
Research Materials
Miscellaneous
