Review
. 2012 Jul;32(7):1222-32.
doi: 10.1038/jcbfm.2012.35. Epub 2012 Mar 21.

Updated energy budgets for neural computation in the neocortex and cerebellum

Affiliations
Review

Updated energy budgets for neural computation in the neocortex and cerebellum

Clare Howarth et al. J Cereb Blood Flow Metab. 2012 Jul.

Abstract

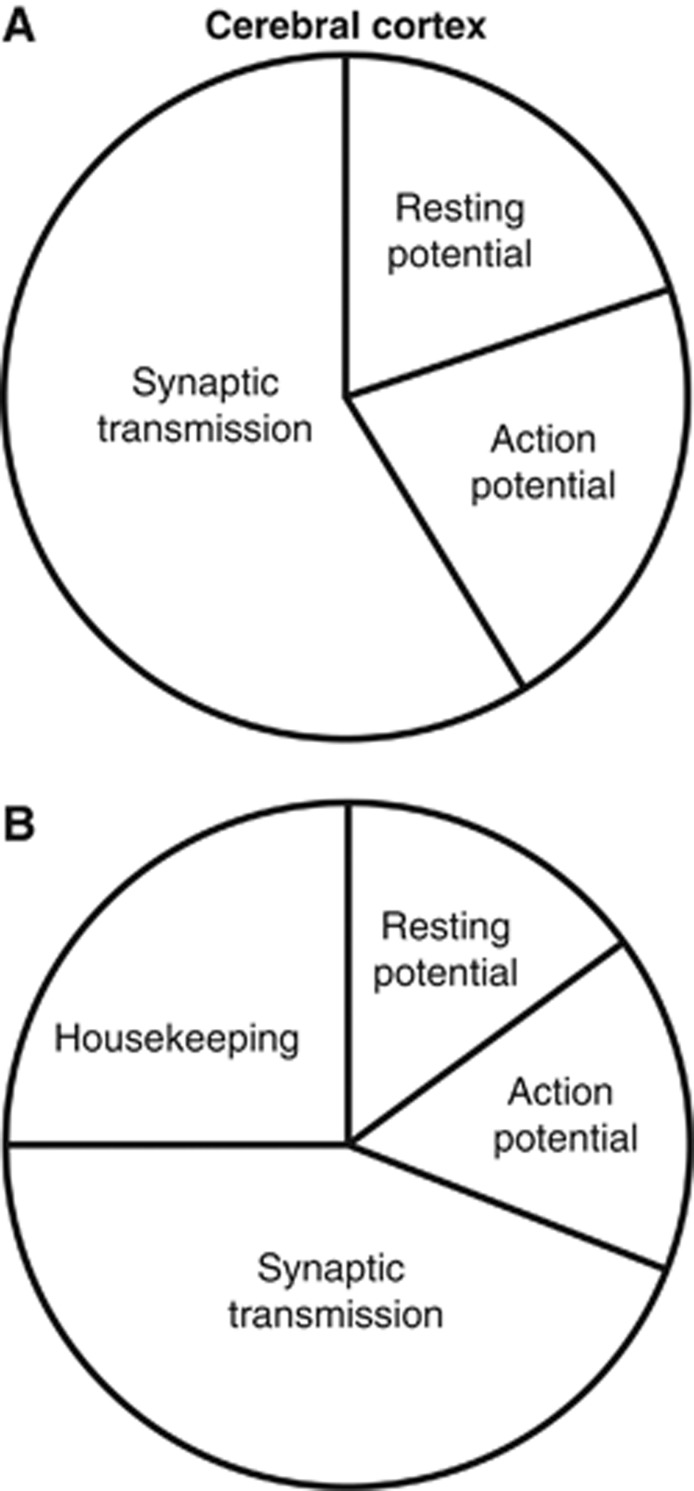
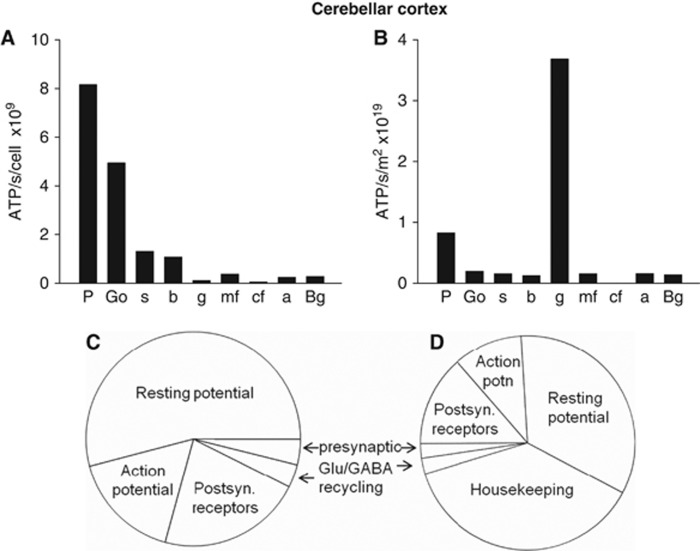
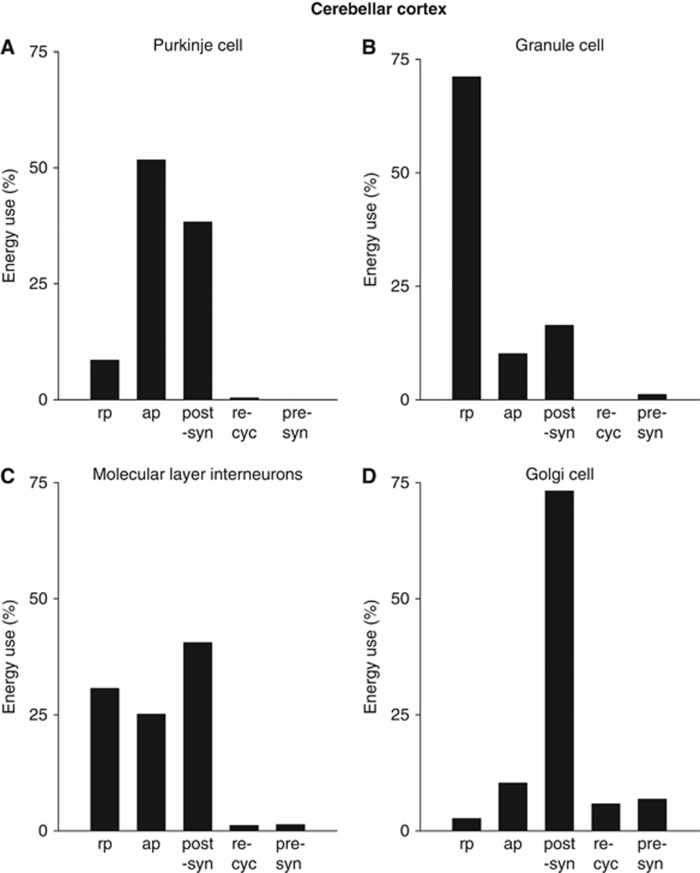
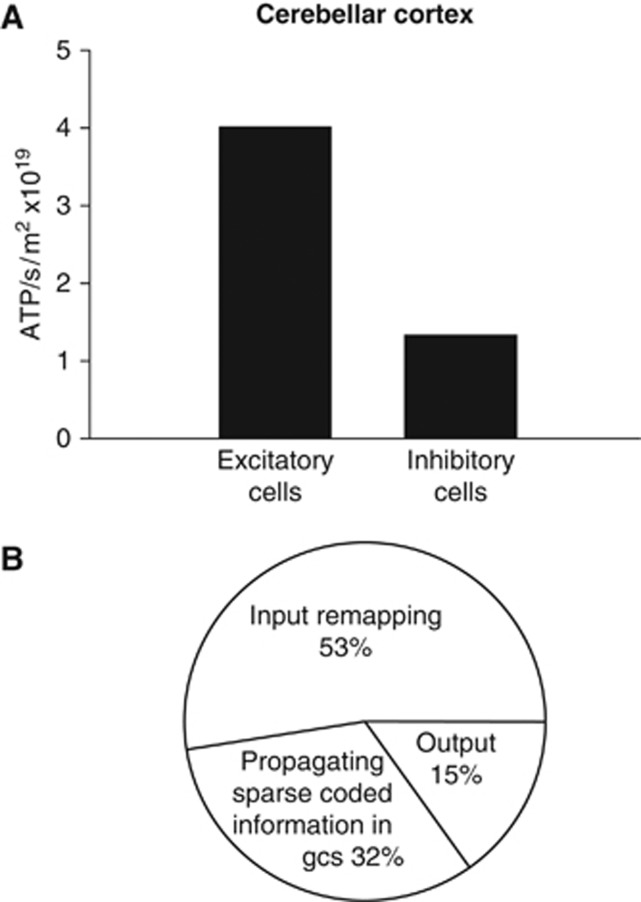
The brain's energy supply determines its information processing power, and generates functional imaging signals. The energy use on the different subcellular processes underlying neural information processing has been estimated previously for the grey matter of the cerebral and cerebellar cortex. However, these estimates need reevaluating following recent work demonstrating that action potentials in mammalian neurons are much more energy efficient than was previously thought. Using this new knowledge, this paper provides revised estimates for the energy expenditure on neural computation in a simple model for the cerebral cortex and a detailed model of the cerebellar cortex. In cerebral cortex, most signaling energy (50%) is used on postsynaptic glutamate receptors, 21% is used on action potentials, 20% on resting potentials, 5% on presynaptic transmitter release, and 4% on transmitter recycling. In the cerebellar cortex, excitatory neurons use 75% and inhibitory neurons 25% of the signaling energy, and most energy is used on information processing by non-principal neurons: Purkinje cells use only 15% of the signaling energy. The majority of cerebellar signaling energy use is on the maintenance of resting potentials (54%) and postsynaptic receptors (22%), while action potentials account for only 17% of the signaling energy use.


Figures

Figure 1
Figure 1
Predicted signaling energy use for cerebral cortex. (A) Energy distribution among subcellular processes for the cerebral cortex. Resting potentials account for ∼20% of the total energy use, action potentials 21%, and synaptic processes 59% (including postsynaptic receptors (50%), neurotransmitter recycling (4%), and presynaptic Ca2+ entry and vesicle cycling (5%)). (B) As panel A, but including non-signaling energy use, assumed to be 6.81 × 10²² ATP/s/m3, that is, 1/3 of the neuronal signaling energy, so that housekeeping tasks are assumed to account for 25% of the total energy use. On this basis, resting potentials use 15%, action potentials 16%, and synaptic processes 44% of the total energy use.
Figure 2
Figure 2
Predicted signaling energy use for cerebellar cortex. (A) Cellular distribution of predicted energy use (ATP used per cell). a, astrocyte; b, basket cell; Bg, Bergmann glia; cf, climbing fiber; g, granule cell; Go, Golgi cell; mf, mossy fiber; P, Purkinje cell; s, stellate cell. (B) Cellular distribution of energy use, taking density of cells into account (ATP use per class of cell). (C) Energy distribution among subcellular processes (summed over all cell types, weighted by cell densities). Resting potentials account for ∼54% of the total energy use, action potentials 17%, postsynaptic receptors 22%, neurotransmitter recycling (ATP used in glia and on packaging transmitter into vesicles in the releasing cell) 3%, and presynaptic Ca2+ entry and vesicle cycling 4%. (D) As panel C, but including non-signaling energy use, assumed to be 7.7 μmol ATP/g/min (20.5–12.8 μmol ATP/g/min, see text). Housekeeping tasks then account for 38% of the energy use, resting potentials 34%, action potentials 10%, postsynaptic receptors 14%, neurotransmitter recycling (ATP used in glia and on packaging transmitter into vesicles in the releasing cell) 2%, and presynaptic Ca2+ entry and vesicle cycling 2%.
Figure 3
Figure 3
The subcellular distribution of cerebellar energy use by cell type. (A) Purkinje cells. Most energy is used on action potentials and postsynaptic receptors. (B) Granule cells. Most energy is used to maintain the resting potential along the long parallel fibers. (C, D) Inhibitory neurons use most energy on postsynaptic receptors and action potentials. (C) Molecular layer interneurons. (D) Golgi cells. ap, action potentials; post-syn, postsynaptic receptors; pre-syn, presynaptic Ca2+ entry and vesicle cycling; re-cyc, transmitter recycling (ATP used on glial uptake of transmitter and its metabolic processing, and on packaging transmitter into vesicles in the releasing cell); rp, resting potential.
Figure 4
Figure 4
Predicted energy use on different aspects of cerebellar computation. (A) Comparison of energy use by excitatory and inhibitory neurons. (B) Energy use on different stages of cerebellar computation.
Figure 5
Figure 5
Laminar distribution of cerebellar energy use correlates better with energy supply than with cellular membrane area. Distribution of predicted energy use, calculated membrane area, and measured blood vessel surface area between the molecular and granular layers. Data for membrane area and blood vessel surface area are taken from Howarth et al (2010).

References

    1. Abeles M.1991Corticonics: Neural Circuits of the Cerebral CortexCambridge: Cambridge University Press
    1. Alle H, Roth A, Geiger JR. Energy-efficient action potentials in hippocampal mossy fibres. Science. 2009;325:1349–1351. - PubMed
    1. Ames A, III, Li YY. Energy requirements of glutamatergic pathways in rabbit retina. J Neurosci. 1992;12:4234–4242. - PMC - PubMed
    1. Ames A, III, Li YY, Heher EC, Kimble CR. Energy metabolism of rabbit retina as related to function: high cost of Na+ transport. J Neurosci. 1992;12:840–853. - PMC - PubMed
    1. Astrup J, Sorensen PM, Sorensen HR. Oxygen and glucose consumption related to Na+--K+ transport in canine brain. Stroke. 1981;12:726–730. - PubMed

Publication types