. 2012 May;153(5):2189-97.
doi: 10.1210/en.2011-2031. Epub 2012 Mar 20.

Angiotensin-(1-7) administration reduces oxidative stress in diabetic bone marrow

Affiliations

Angiotensin-(1-7) administration reduces oxidative stress in diabetic bone marrow

N M Mordwinkin et al. Endocrinology. 2012 May.

Abstract

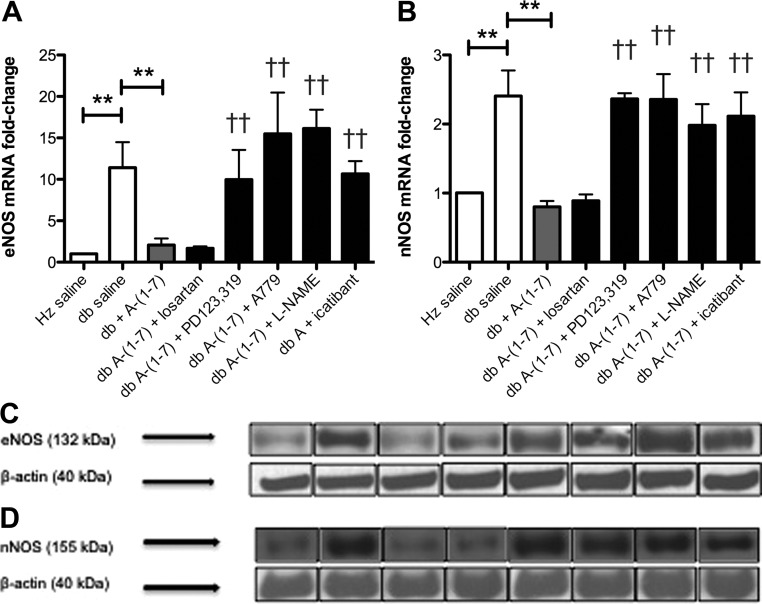
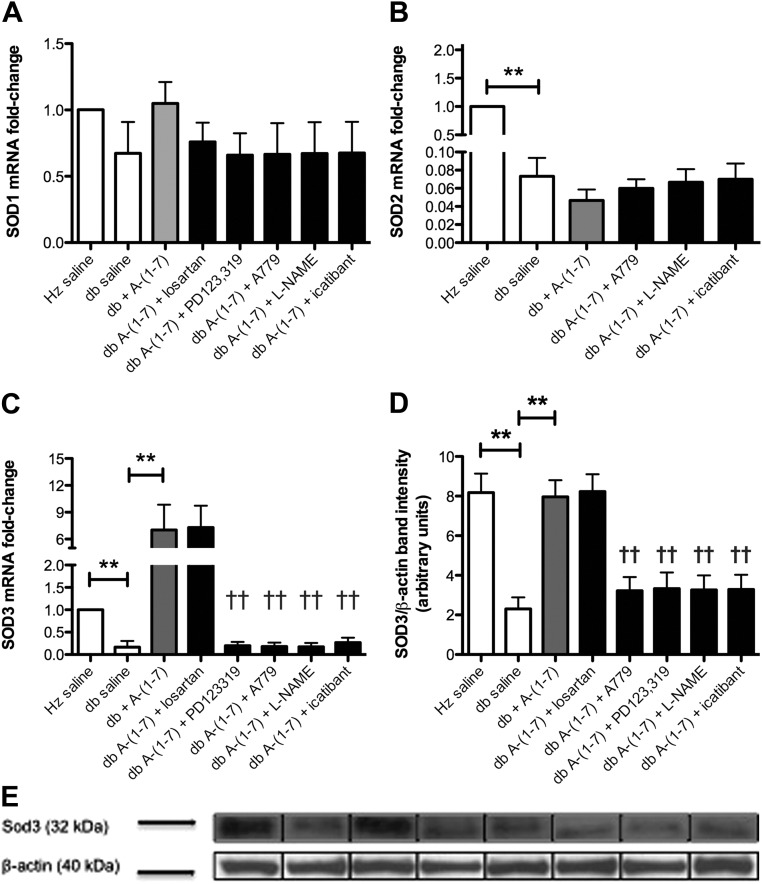
Diabetics have an increased risk of developing cardiovascular disease, in part due to oxidative stress, resulting in endothelial nitric oxide synthase (eNOS) dysfunction. Studies have demonstrated that angiotensin-(1-7) [Ang-(1-7)] can activate eNOS activity. Because the bone marrow is a primary source of a number of progenitors important in physiological homeostasis and healing, the goal of this study was to evaluate the in vivo effects of Ang-(1-7) treatment on oxidative stress and the ensuing nitrative stress in diabetic bone marrow and its potential pathways. BKS.Cg-Dock7(m) +/+ Lepr(db)/J mice and their heterozygous controls were administered Ang-(1-7) alone or combined with A-779, losartan, PD123,319, nitro-l-arginine methyl ester, or icatibant sc for 14 d. The bone marrow was then collected to measure nitric oxide levels, eNOS phosphorylation, and expression of nitric oxide synthase, superoxide dismutase, and p22-phox. Nitric oxide levels in the bone marrow were significantly decreased in diabetic mice, and Ang-(1-7) treatment was able to significantly increase these measures (P < 0.01). This effect was blocked by the coadministration of PD123,319, A-779, nitro-l-arginine methyl ester, and icatibant. In addition, Ang-(1-7) treatment reversed the paradoxical increase in eNOS and neuronal nitric oxide synthase expression and decreased the phosphorylation of eNOS at Thr495 seen in diabetic mice. Ang-(1-7) also reversed diabetes-induced production of reactive oxygen species by decreasing p22-phox expression and increasing superoxide dismutase 3 expression, leading to a significant reduction in 3-nitrotyrosine formation in diabetic bone marrow (P < 0.05). Our findings demonstrate that Ang-(1-7) administration decreases diabetes-induced oxidative stress in the bone marrow and modifies pathways involved in eNOS dysfunction.


Figures

Fig. 1.
Fig. 1.
A and B, Effect of Ang-(1–7) on bone marrow NO levels. Bone marrow ROS levels were significantly higher in diabetic mice compared with nondiabetic controls (P < 0.01). Treatment of diabetic mice with Ang-(1–7) resulted in a significant decrease in bone marrow ROS levels compared with saline-treated diabetic mice (P < 0.01). Coadministration of losartan, PD123,319, A-779, or L-NAME with Ang-(1–7) significantly increased bone marrow ROS levels compared with diabetic mice treated with Ang-(1–7) alone (P < 0.01). Bone marrow NO levels were significantly lower in diabetic mice compared with nondiabetic controls (P < 0.01). Treatment of diabetic mice with Ang-(1–7) for 14 d resulted in a significant increase in bone marrow NO levels compared with saline-treated diabetic mice (P < 0.01). Coadministration of PD123,319, A-779, or L-NAME with Ang-(1–7) significantly reduced bone marrow NO levels compared with diabetic mice treated with Ang-(1–7) alone (P < 0.05), whereas coadministration of Ang-(1–7) with either losartan or icatibant did not have a significant effect on bone marrow NO levels compared with Ang-(1–7) alone. **, P < 0.01; †, P < 0.05 compared with diabetic + Ang-(1–7) group; ††, P < 0.01 compared with diabetic + Ang-(1–7) group.
Fig. 2.
Fig. 2.
A–D, Ang-(1–7) effects on NOS isoform expression. Bone marrow eNOS mRNA expression (A) and protein levels (C) as well as nNOS mRNA expression (B) and protein expression (D) were significantly higher in diabetic mice compared with nondiabetic controls, respectively (P < 0.01). Diabetic mice administered Ang-(1–7) had significantly lower bone marrow eNOS and nNOS mRNA and protein expression compared with saline-treated diabetic mice after 14 d of treatment (P < 0.01). Coadministration of PD123,319, A-779, L-NAME, or icatibant with Ang-(1–7) resulted in a significant increase in bone marrow eNOS and nNOS mRNA and protein expression in diabetic mice compared to treatment with Ang-(1–7) alone (P < 0.01). **, P < 0.01; ††, P < 0.01 compared to the db + Ang-(1–7) group.
Fig. 3.
Fig. 3.
A and B, Ang-(1–7) activates bone marrow eNOS. Phosphorylation of bone marrow eNOS at Ser1177 was significantly decreased in diabetic mice compared with nondiabetic controls (P < 0.01). Diabetic mice treated with Ang-(1–7) for 14 d had significantly increased phosphorylation of bone marrow eNOS at Ser1177 compared with saline-treated diabetic mice (P < 0.01). Coadministration of PD123,319, A-779, L-NAME, or icatibant with Ang-(1–7) resulted in a significant reduction in phosphorylation of bone marrow eNOS at Ser1177 in diabetic mice compared with treatment with Ang-(1–7) alone (P < 0.01). Phosphorylation of bone marrow eNOS at Thr495 was significantly increased in diabetic mice compared with nondiabetic controls (P < 0.01). Diabetic mice treated with Ang-(1–7) for 14 d had significantly decreased phosphorylation of bone marrow eNOS at Thr495 compared with saline-treated diabetic mice (P < 0.01). Coadministration of PD123,319, A-779, L-NAME, or icatibant with Ang-(1–7) resulted in a significant increase in phosphorylation of bone marrow eNOS at Thr495 in diabetic mice compared with treatment with Ang-(1–7) alone (P < 0.01). **, P < 0.01; ††, P < 0.01 compared to the db + Ang-(1–7) group.
Fig. 4.
Fig. 4.
A–E, Effects of Ang-(1–7) on bone marrow SOD expression. There were no significant differences in bone marrow SOD1 mRNA expression between any groups (A). Both bone marrow SOD2 (B) and SOD3 (C) mRNA expression were significantly reduced in diabetic mice compared with nondiabetic controls (P < 0.01). Although treatment with Ang-(1–7) for 14 d did not have a significant effect on SOD2 mRNA expression, treatment with Ang-(1–7) significantly increased bone marrow SOD3 mRNA expression in diabetic mice. Coadministration of PD123,319, A-779, L-NAME, or icatibant with Ang-(1–7) resulted in a significant decrease in bone marrow SOD3 mRNA expression in diabetic mice compared to treatment with Ang-(1–7) alone (P < 0.01). SOD3 protein expression (D and E) was significantly reduced in diabetic mice compared with nondiabetic controls (P < 0.01), and the administration of Ang-(1–7) to diabetic mice significantly increased bone marrow SOD3 protein expression (P < 0.01). Coadministration of PD123,319, A-779, L-NAME, or icatibant with Ang-(1–7) significantly inhibited its effect in diabrtic mice (P < 0.01). **, P < 0.01; ††, P < 0.01 compared to the db + Ang-(1–7) group.
Fig. 5.
Fig. 5.
A and B, Ang-(1–7) decreases bone marrow p22-phox expression. Bone marrow p22-phox mRNA expression was significantly higher in diabetic mice compared with nondiabetic controls (P < 0.01). Treatment of diabetic mice with Ang-(1–7) for 14 d resulted in a significant decrease in bone marrow p22-phox mRNA expression, comparable with levels measured in nondiabetic controls (P < 0.01). Coadministration of PD123,319, A-779, L-NAME, or icatibant with Ang-(1–7) resulted in significantly higher p22-phox mRNA expression compared with treatment with Ang-(1–7) alone (P < 0.01). There was also a significant increase in bone marrow p22-phox protein expression diabetic mice compared with nondiabetic controls (P < 0.01). Administration of Ang-(1–7) for 14 d significantly decreased bone marrow p22-phox protein expression in diabetic mice, whereas the coadministration of PD123,319, A-779, L-NAME, or icatibant with Ang-(1–7) significantly blocked this effect compared with treatment with Ang-(1–7) alone (P < 0.01). **, P < 0.01; ††, P < 0.01 compared to the db + Ang-(1–7) group.
Fig. 6.
Fig. 6.
A and B, Bone marrow tyrosine nitration and correlation with nitrite levels. Nucleated bone marrow cells from diabetic mice had a significantly higher percent tyrosine nitration compared with nondiabetic controls (P < 0.01). After treatment with Ang-(1–7) for 14 d, the percentage of cells nitrated in diabetic bone marrow was significantly decreased (P < 0.01). Coadministration of Ang-(1–7) with A-779, PD123,319, L-NAME, or icatibant resulted in a significant increase in bone marrow tyrosine nitration (P < 0.05), whereas coadministration of Ang-(1–7) with losartan did not result in a significant change compared with Ang-(1–7) treatment alone. The scatter plot of the relationship between bone marrow nitrite levels and percent tyrosine nitration in nondiabetic and diabetic mice shows a significant negative correlation (P < 0.01). **, P < 0.01; ††, P < 0.01 compared to the db + Ang-(1–7) group.

References

    1. Maritim AC, Sanders RA, Watkins JB., 3rd 2003. Diabetes, oxidative stress, and antioxidants: a review. J Biochem Mol Toxicol 17:24–38 - PubMed
    1. Kocic R, Radenkovic S, Mikic D, Kocic G, Cvetkovic T, Pavlovic D. 1998. Oxidative stress in the development of diabetes during hypothyroidism. Postgrad Med J 74:381. - PMC - PubMed
    1. Ceriello A, Motz E. 2004. Is oxidative stress the pathogenic mechanism underlying insulin resistance, diabetes, and cardiovascular disease? The common soil hypothesis revisited. Arterioscler Thromb Vasc Biol 24:816–823 - PubMed
    1. Radi R. 2004. Nitric oxide, oxidants, and protein tyrosine nitration. Proc Natl Acad Sci USA 101:4003–4008 - PMC - PubMed
    1. Zou MH, Cohen R, Ullrich V. 2004. Peroxynitrite and vascular endothelial dysfunction in diabetes mellitus. Endothelium 11:89–97 - PubMed

Publication types