. 2012 Jun;22(6):1098-106.
doi: 10.1101/gr.131649.111. Epub 2012 Mar 20.

Unusual combinatorial involvement of poly-A/T tracts in organizing genes and chromatin in Dictyostelium

Affiliations

Unusual combinatorial involvement of poly-A/T tracts in organizing genes and chromatin in Dictyostelium

Gue Su Chang et al. Genome Res. 2012 Jun.

Abstract

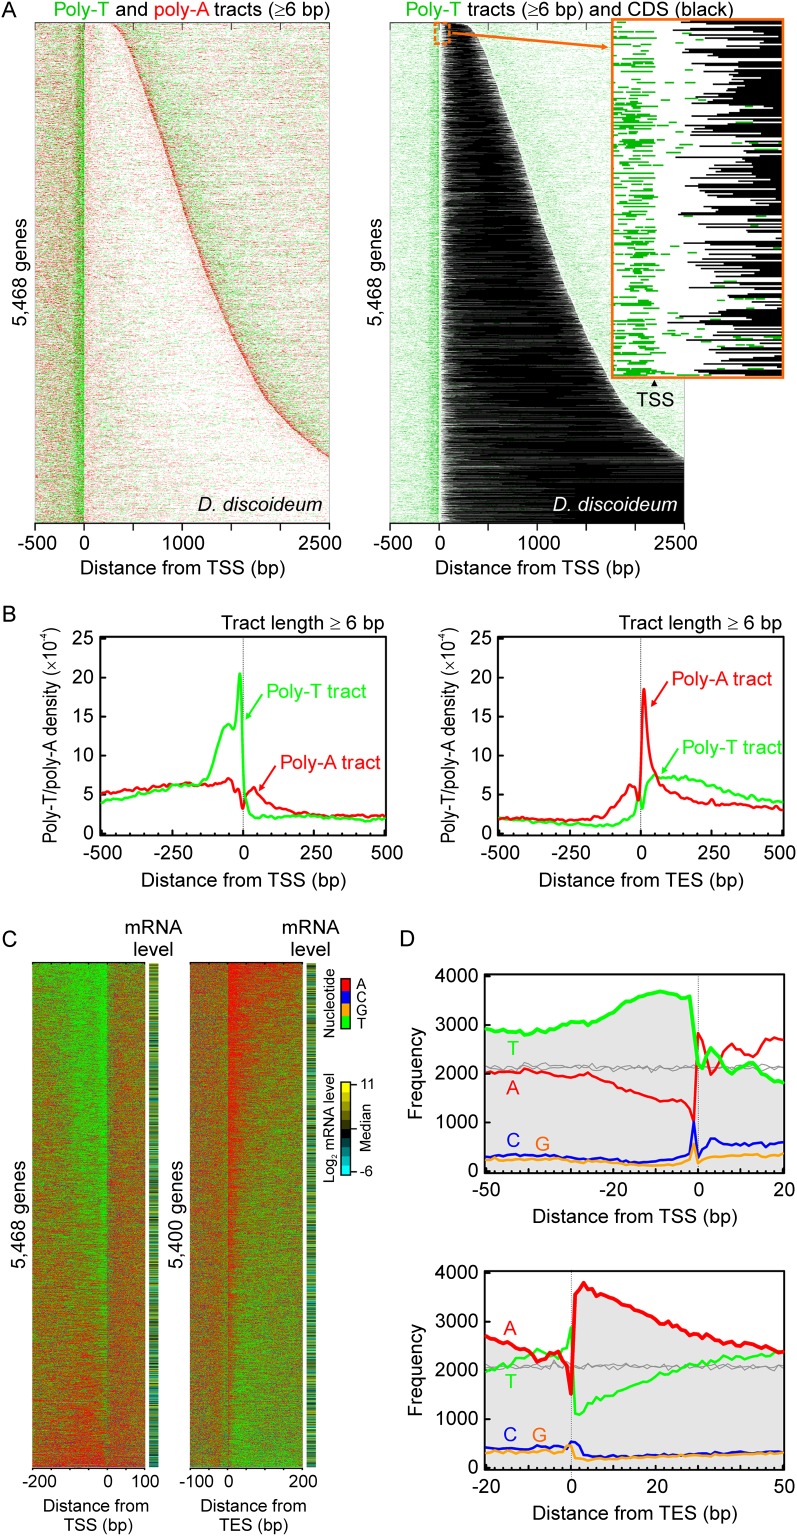
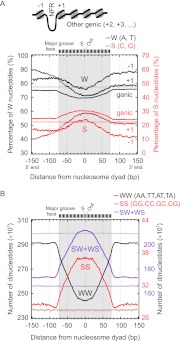
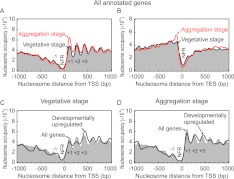
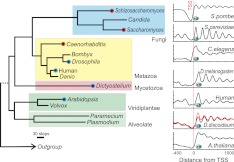
Dictyostelium discoideum is an amoebozoa that exists in both a free-living unicellular and a multicellular form. It is situated in a deep branch in the evolutionary tree and is particularly noteworthy in having a very A/T-rich genome. Dictyostelium provides an ideal system to examine the extreme to which nucleotide bias may be employed in organizing promoters, genes, and nucleosomes across a genome. We find that Dictyostelium genes are demarcated precisely at their 5' ends by poly-T tracts and precisely at their 3' ends by poly-A tracts. These tracts are also associated with nucleosome-free regions and are embedded with precisely positioned TATA boxes. Homo- and heteropolymeric tracts of A and T demarcate nucleosome border regions. Together, these findings reveal the presence of a variety of functionally distinct polymeric A/T elements. Strikingly, Dictyostelium chromatin may be organized in di-nucleosome units but is otherwise organized as in animals. This includes a +1 nucleosome in a position that predicts the presence of a paused RNA polymerase II. Indeed, we find a strong phylogenetic relationship between the presence of the NELF pausing factor and positioning of the +1 nucleosome. Pausing and +1 nucleosome positioning may have coevolved in animals.


Figures

Figure 1.
Figure 1.
Dictyostelium gene organization with poly-T/poly-A enrichment. (A) Distribution of poly-T/poly-A tracts (≥6 bp) in 5468 genes with the annotated TSS. Each track represents the DNA sequence of a gene, fetched from −500 to 2500 relative to the TSS. Genes were aligned by their TSS, and their DNA sequence in the sense strand was oriented in the 5′ to 3′ direction. If any poly-T/poly-A tract of length six or more was found in the DNA sequences, the poly-T sequence was colored in green and the poly-A sequence in red, and all the others were drawn as white in the sequence. The genes were sorted in ascending order of length. The right panel shows poly-T tracts as green and coding sequences as black. A zoom-in screenshot demonstrates the positional details in poly-T enrichment at TSS and translation start sites. (B) Composite distribution of the location of poly-T/poly-A tracts around the 5′ and 3′ end of Dictyostelium genes. The density distribution of poly-T/poly-A tracts (≥6 bp) was displayed as a function of the distance (bp) on the sense strand between the midpoint of each nonoverlapping tract and the given TSS (or TES). The density of the occurrence of poly-T (green trace) and poly-A tracts (red trace) is shown in the y-axis, which was estimated by Gaussian kernel and a smoothing bandwidth of 5. The density curve was calculated within the range from −1500 to 1500 relative to the TSS (or TES) and only the −500 to 500 region shown in the figure. (C) Transcription start (TSS) and end (TES) site are linked to high T and A enrichment, respectively, in the adjacent intergenic sequence. Each track represents the sense strand of a gene, fetched from 200 bp intergenic to 100 genic relative to the TSS (or TES) of 5468 (or 5400) protein-coding genes. Genes are aligned by the TSS (left) or TES (right), in the 5′ to 3′ direction from left to right. Transcript abundance is shown for each gene in an adjacent column. Genes were ordered by descending T (left) or A (right) density of their extracted sequence (301 bp). Color codes for the four nucleotides are indicated. This trend was not observed with randomization simulations (not shown). (D) Frequency distribution of A, C, G, and T relative to the TSS and TES. Shown is a summation of columns from panel C, over the indicated distance, color-coded as in panel C. The same simulation was applied to a set of TSSs or TESs randomly positioned across the Dictyostelium genome (gray traces, shown for A and T).
Figure 2.
Figure 2.
Frequency distribution of TATA elements as TATAAA(A/T)(A/T) midpoint locations around the 5′ and 3′ ends of Dictyostelium genes. TATA elements were counted on the sense (black trace) and template (red trace) strand. Their frequency was binned at the 5-bp interval and plotted as a function of the distance from the TSS (A) and TES (B). The frequency distribution of poly-T/poly-A tract locations (≥12 bp) was produced in the same way and is shown in gray.
Figure 3.
Figure 3.
Nucleosomal DNA properties of Dictyostelium nucleosomes. (A) 73,396 nucleosome dyad locations were grouped as −1 (N = 3230), +1 (N = 7285), and all other genic nucleosomes (N = 63,643) (see diagram). For the three assigned nucleosome groups, the W (= A/T in black) and S (= G/C in red) nucleotide percentage at each position was calculated on the sense strand (5′ → 3′ from left to right), so as to maintain directionality of the frequency patterns with respect to the TSS. Plots were smoothed via a 3-bp moving average. (Gray and light red) Randomized distributions. The schematic bar in the upper part represents the rotational orientation of the major groove against the histone octamer surface. (B) Frequency distribution of the WW, SS, and SW+WS dinucleotides relative to nucleosome dyads, as described in Albert et al. (2007) and with the same randomization.
Figure 4.
Figure 4.
Nucleosome organization around the 5′ and 3′ end of the Dictyostelium genes. (A,B) Composite distribution of in vivo nucleosome positions relative to the TSS and TES. The midpoints of all nucleosomal sequence reads were distributed around the TSS (or TES) of 5468 (or 5400) protein-coding genes, plotted as described in Figure 1B and smoothed with a bandwidth of 15 bp. The free-living (vegetative) and multicellular (aggregation) stages are indicated by black and red traces, respectively. (C,D) Nucleosome organization around the TSS of 325 developmentally up-regulated genes (black trace) in the vegetative and aggregation stages, compared to all nucleosomes (gray fill). Traces were smoothed with a 30-bp bandwidth.
Figure 5.
Figure 5.
Comparison of inter-nucleosomal distances between five species in their nucleosome arrangement within the genic region. The canonical inter-nucleosomal distance (bp) between two neighboring nucleosomes (for example, +1 and +2) was calculated as the peak-to-peak distance, which was measured in the composite distribution of in vivo nucleosome locations. The nucleosome distribution of each species was produced as described in Methods. The nucleosomal repeat length (as an averaged distance between neighboring nucleosomes) is reported in Supplemental Table S2B.
Figure 6.
Figure 6.
Chromatin structure around the 5′ end of genes evolutionarily conserved across major eukaryotes. The data of genome-wide nucleosome positions in vivo were curated from the literature and the composite distributions of nucleosome locations were shown for each species in the right panel, aligned by the TSS. The life tree was adapted from the kingdom-level phylogenetic tree of eukaryotes (Baldauf et al. 2000) and simplified in the figure. (Red circle) Those having a substantial portion of the nucleosome over the TSS; (blue circle) those where the TSS is located in the NFR. See Supplemental Table S2A for consensus positions.

References

    1. Albert I, Mavrich TN, Tomsho LP, Qi J, Zanton SJ, Schuster SC, Pugh BF 2007. Translational and rotational settings of H2A.Z nucleosomes across the Saccharomyces cerevisiae genome. Nature 446: 572–576 - PubMed
    1. Bailey TL, Elkan C 1994. Fitting a mixture model by expectation maximization to discover motifs in biopolymers. Proc Int Conf Intell Syst Mol Biol 2: 28–36 - PubMed
    1. Baldauf SL, Roger AJ, Wenk-Siefert I, Doolittle WF 2000. A kingdom-level phylogeny of eukaryotes based on combined protein data. Science 290: 972–977 - PubMed
    1. Basehoar AD, Zanton SJ, Pugh BF 2004. Identification and distinct regulation of yeast TATA box-containing genes. Cell 116: 699–709 - PubMed
    1. Bloomfield G, Tanaka Y, Skelton J, Ivens A, Kay RR 2008. Widespread duplications in the genomes of laboratory stocks of Dictyostelium discoideum. Genome Biol 9: R75 doi: 10.1186/gb-2008-9-4-r75 - PMC - PubMed

Publication types

LinkOut - more resources