Comparative Study
. 2012 Nov;18(11):2120-7.
doi: 10.1002/ibd.22952. Epub 2012 Mar 20.

Defective tumor necrosis factor release from Crohn's disease macrophages in response to Toll-like receptor activation: relationship to phenotype and genome-wide association susceptibility loci

Affiliations
Free PMC article
Comparative Study

Defective tumor necrosis factor release from Crohn's disease macrophages in response to Toll-like receptor activation: relationship to phenotype and genome-wide association susceptibility loci

Gavin W Sewell et al. Inflamm Bowel Dis. 2012 Nov.
Free PMC article

Abstract

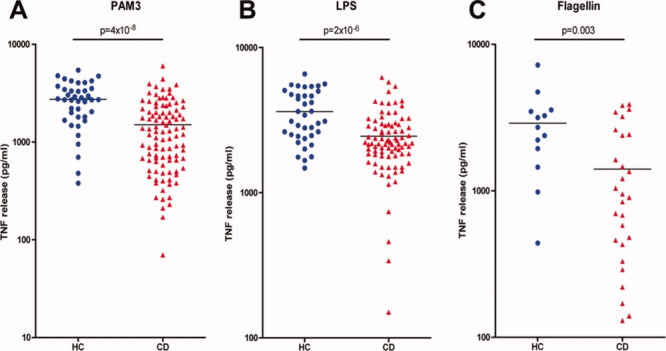
Background: Recent work provides evidence of a failure of acute inflammation in Crohn's disease (CD), and suggests that the primary defect operates at the level of the macrophage and cytokine release. Here we extend the characterization of the innate immune defect in CD by investigating the macrophage response to Toll-like receptor (TLR) agonists and assess potential links between genome-wide association study (GWAS) susceptibility loci, disease phenotype, and therapeutic regimens on tumor necrosis factor α (TNF) release.

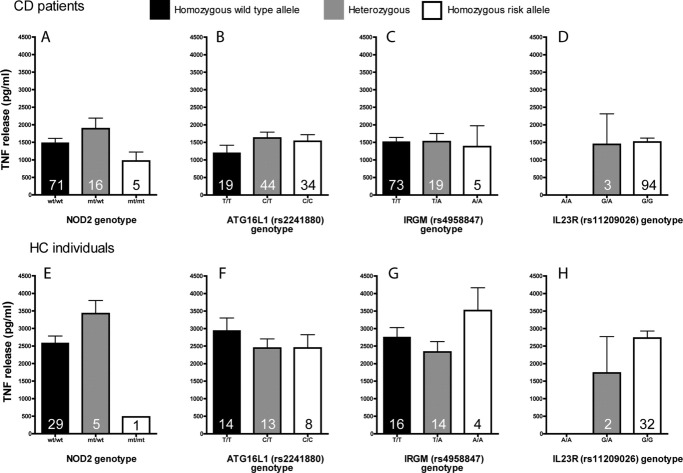
Methods: Peripheral blood-derived macrophages were cultured from control subjects and patients with CD, stimulated with TLR ligands, and the release of TNF measured. Genomic DNA was purified from blood and genotyped for 34 single nucleotide polymorphisms (SNPs) identified as being associated with CD by GWAS.

Results: All stimuli resulted in a reduction (32%-48%) in TNF release from macrophages derived from CD patients (n = 28-101) compared to those from healthy control (HC) subjects. All phenotypes demonstrated impaired TNF release, with the greatest defect in patients with colonic disease. There was no detectable relationship between the level of TNF released and the presence of GWAS susceptibility loci in CD patients. Reduced TNF levels were not influenced by age, gender, or use of aminosalicylate (5-ASA) medication.

Conclusions: This study supports the hypothesis of defective proinflammatory cytokine secretion and an innate immunodeficiency in CD. Abnormal TNF secretion is evident downstream of multiple TLRs, affects all disease phenotypes, and is unrelated to 34 polymorphisms associated with CD by GWAS.


Figures

Figure 1
Figure 1
Macrophages from CD patients release attenuated TNF in response to TLR stimulation. Monocyte-derived macrophages stimulated for 6 hours with PAM3CSK4 (PAM3), LPS, and flagellin, and TNF levels in supernatants were quantified using the TNF bioassay. (A) TLR2 response was measured in macrophages from HC (n = 41) and CD (n = 101) after PAM3 stimulation. (B) TLR4 response was measured in macrophages from HC (n = 38) and CD (n = 87) after LPS stimulation. (C) TLR5 response was measured in macrophages from HC (n = 13) and CD (n = 28) after flagellin stimulation. TNF levels from each subject are depicted with the mean value shown as a black horizontal bar with P-value. Data are shown on a logarithmic scale. [Color figure can be viewed in the online issue, which is available at wileyonlinelibrary.com.]
Figure 2
Figure 2
Defective TNF release is common to all phenotypes. CD subjects were divided into three phenotypic subgroups based on disease location, including ileal (L1, n = 32), colonic (L2, n = 44), and ileocolonic (L3, n = 24) involvement. (A) There were no significant differences in macrophage TNF release after TLR2 stimulation between disease phenotypes. (B) Macrophages from patients with colonic CD release significantly less TNF than ileal patients after TLR4 stimulation with LPS. Macrophages from all groups released significantly less TNF than the HC cohort in response to TLR2 and TLR4 stimulation. Results expressed as mean ± SEM with P-value.
Figure 3
Figure 3
TNF secretion after TLR2 and TLR4 activation in relation to medical treatment, smoking, and gender. CD patients and where applicable HC were divided by (A) treatment (CD no-treatment n = 25, 5-ASA treatment n = 76; HC n = 38), (B) smoking (CD smoker n = 20, nonsmoker n = 81), and (C) gender, (CD male [M] n = 37, female [F] n = 64; HC male [M] n = 21, female [F] n = 20). All results are expressed as mean ± SEM with P-value.
Figure 4
Figure 4
Macrophages from UC patients release normal levels of TNF in response to TLR stimulation. Supernatants from macrophages stimulated for 6 hours with PAM3 and LPS were tested for the levels of TNF released. (A) TLR2 response was measured in macrophages from HC (n = 41), CD (n = 101), and UC (n = 47) after PAM3 stimulation. (B) TLR4 response was measured in macrophages from HC (n = 38), CD (n = 87), and UC (n = 47) after LPS stimulation. TNF levels from each subject are depicted with the mean value shown as a black horizontal bar with P-value. [Color figure can be viewed in the online issue, which is available at wileyonlinelibrary.com.]
Figure 5
Figure 5
Relationship between TNF secretion after TLR2 activation and GWAS SNPs. Patients were typed for 34 SNPs associated with increased risk of developing CD and separated into homozygous nonrisk (black), heterozygous (gray), and homozygous risk (white) for (A) NOD2 (compound heterozygotes where grouped with homozygous risk), (B) IRGM, (C) ATG16L1, and (D) IL23R and the corresponding TNF levels after TLR2 activation shown. Corresponding results for the HC cohort are shown in (E–H). Results expressed as mean ± SEM with P-value, value shown in each bar represents the number of individuals in each genotype.

References

    1. Podolsky DK. Inflammatory bowel disease. N Engl J Med. 2002;347:417–429. - PubMed
    1. Shanahan F. Crohn's disease. Lancet. 2002;359:62–69. - PubMed
    1. Barrett JC, Hansoul S, Nicolae DL, et al. Genome-wide association defines more than 30 distinct susceptibility loci for Crohn's disease. Nat Genet. 2008;40:955–962. - PMC - PubMed
    1. Franke A, McGovern DP, Barrett JC, et al. Genome-wide meta-analysis increases to 71 the number of confirmed Crohn's disease susceptibility loci. Nat Genet. 2010;42:1118–1125. - PMC - PubMed
    1. Segal AW, Loewi G. Neutrophil dysfunction in Crohn's disease. Lancet. 1976;2:219–221. - PubMed

Publication types

MeSH terms