

Neuroimaging of motor neuron diseases
- PMID: 22435076
- PMCID: PMC3302203
- DOI: 10.1177/1756285612437562
Neuroimaging of motor neuron diseases
Abstract
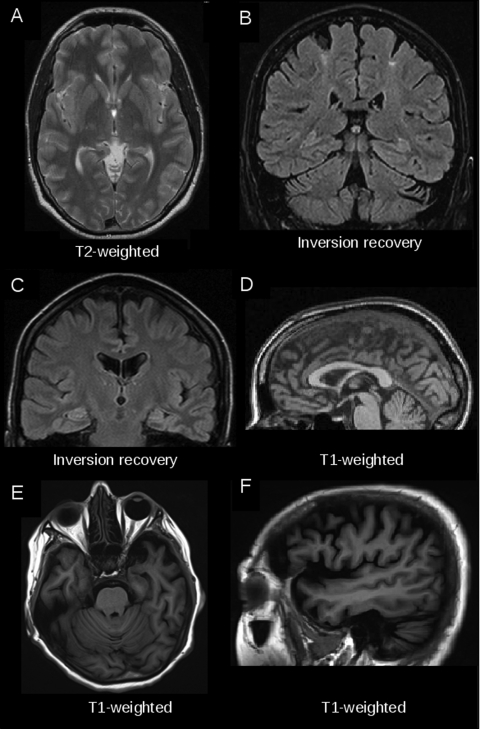
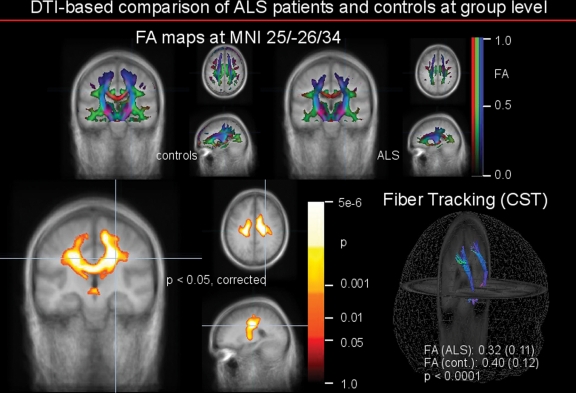
It is agreed that conventional magnetic resonance imaging (MRI) of the brain and spine is one of the core elements in the differential diagnostic work up of patients with clinical signs of motor neuron diseases (MNDs), for example amyotrophic lateral sclerosis (ALS), to exclude MND mimics. However, the sensitivity and specificity of MRI signs in these disorders are moderate to low and do not have an evidence level higher than class IV (good clinical practice point). Currently computerized MRI analyses in ALS and other MNDs are not techniques used for individual diagnosis. However, they have improved the anatomical understanding of pathomorphological alterations in gray and white matter in various MNDs and the changes in functional networks by quantitative comparisons between patients with MND and controls at group level. For multiparametric MRI protocols, including T1-weighted three-dimensional datasets, diffusion-weighted imaging and functional MRI, the potential as a 'dry' surrogate marker is a subject of investigation in natural history studies with well defined patients. The additional value of MRI with respect to early diagnosis at an individual level and for future disease-modifying multicentre trials remains to be defined. There is still the need for more longitudinal studies in the very early stages of disease or when there is clinical uncertainty and for better standardization in the acquisition and postprocessing of computer-based MRI data. These requirements are to be addressed by establishing quality-controlled multicentre neuroimaging databases.
Keywords: DTI; MRI; T1-weighted imaging; amyotrophic lateral sclerosis; motor neuron diseases.
Conflict of interest statement
The authors declare that there is no conflict of interest.
Figures
References
-
- Basser P.J., Jones D.K. (2002) Diffusion-tensor MRI: theory, experimental design and data analysis – a technical review. NMR Biomed 15: 456–467 - PubMed
-
- Ciccarelli O., Behrens T.E., Altmann D.R., Orrell R.W., Howard R.S., Johansen-Berg H., et al. (2006) Probabilistic diffusion tractography: a potential tool to assess the rate of disease progression in amyotrophic lateral sclerosis. Brain 129: 1859–1871 - PubMed
-
- Chan S., Kaufmann P., Shungu D.C., Mitsumoto H. (2003) Amyotrophic lateral sclerosis and primary lateral sclerosis: evidence-based diagnostic evaluation of the upper motor neuron. Neuroimaging Clin N Am 13: 307–326 - PubMed
LinkOut - more resources
Full Text Sources
Miscellaneous
