. 2012 Jul;82(2):172-83.
doi: 10.1038/ki.2012.20. Epub 2012 Mar 21.

Targeted proximal tubule injury triggers interstitial fibrosis and glomerulosclerosis

Affiliations

Targeted proximal tubule injury triggers interstitial fibrosis and glomerulosclerosis

Ivica Grgic et al. Kidney Int. 2012 Jul.

Abstract

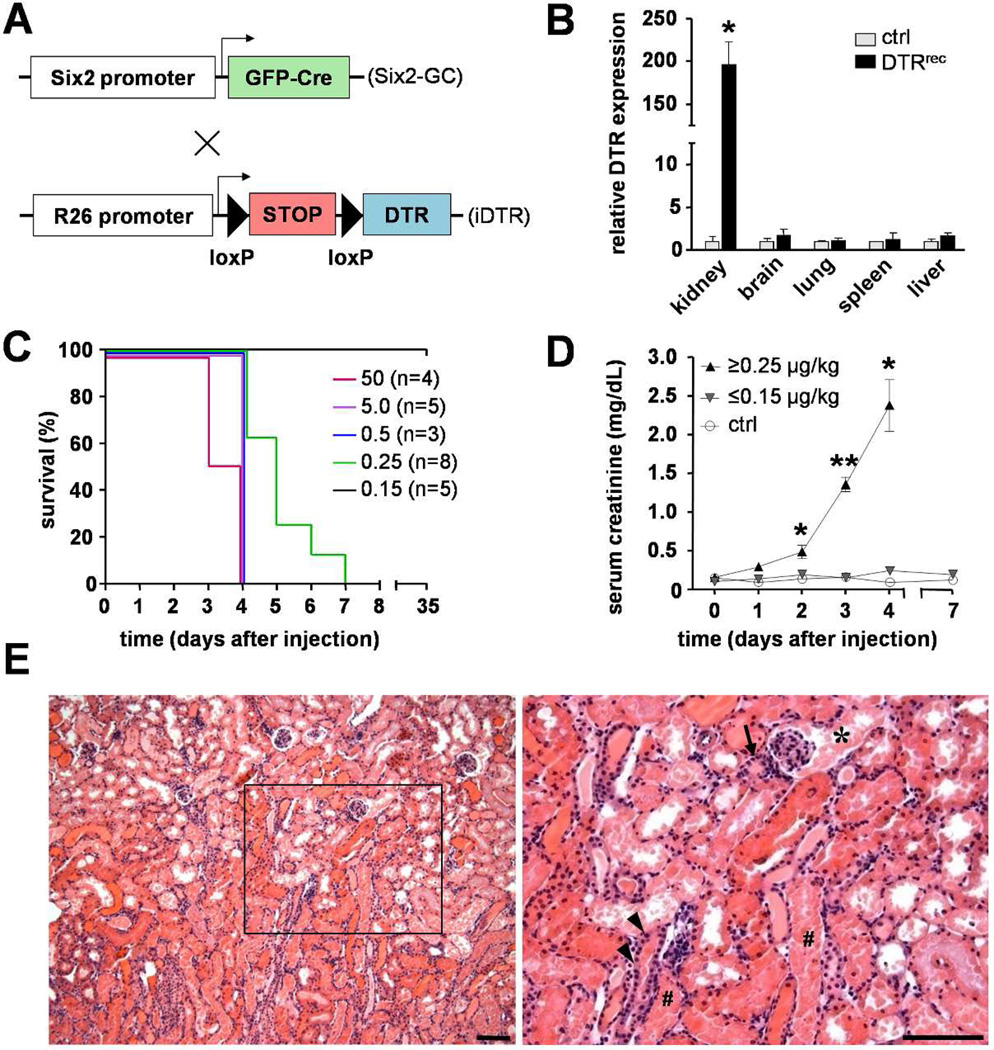
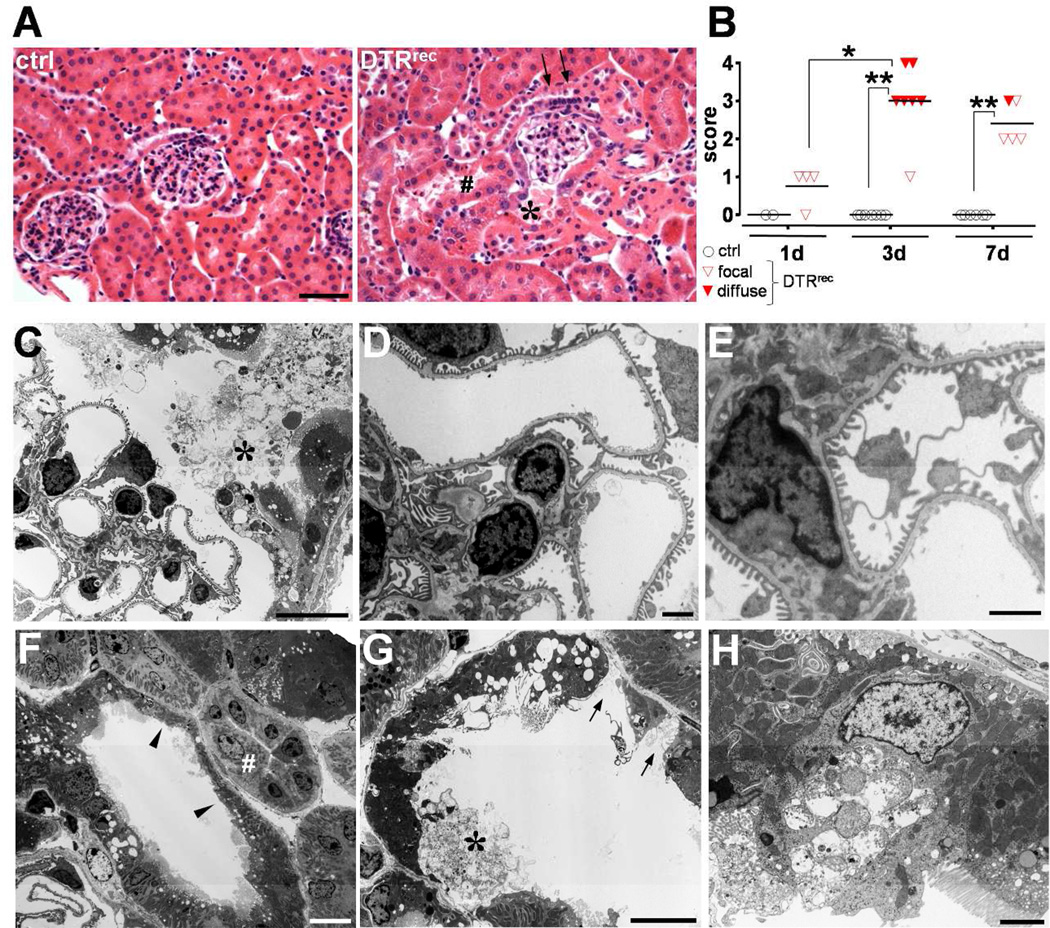
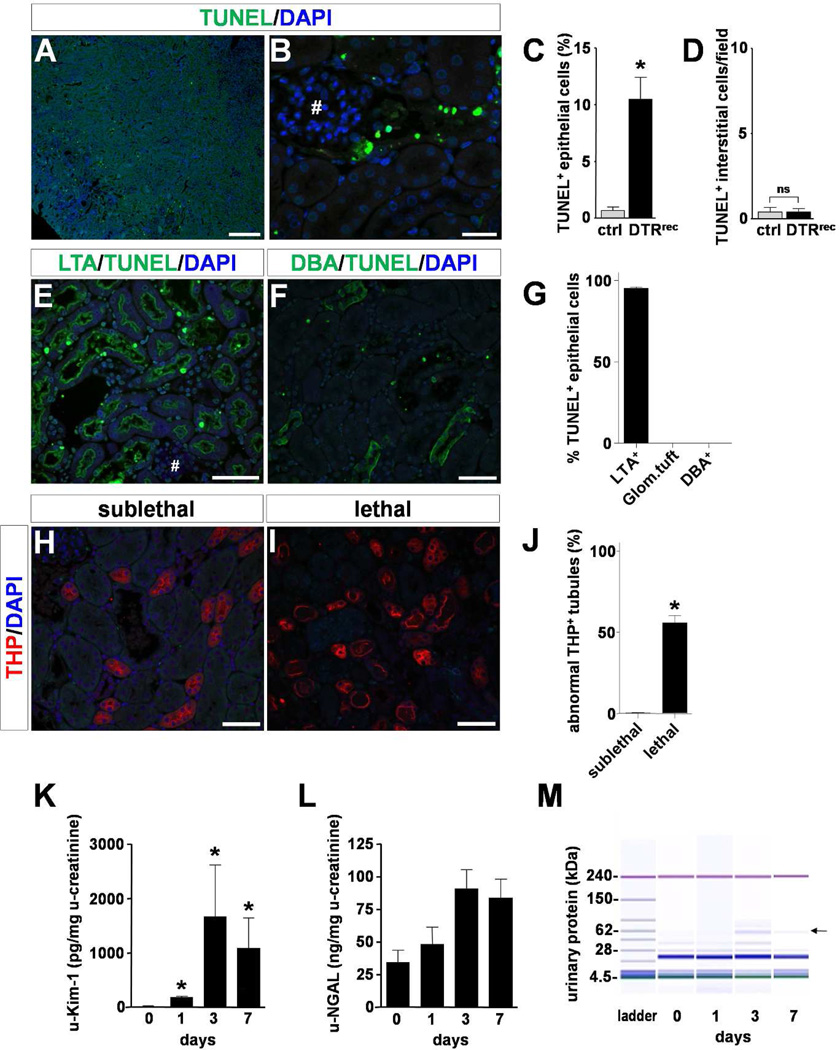
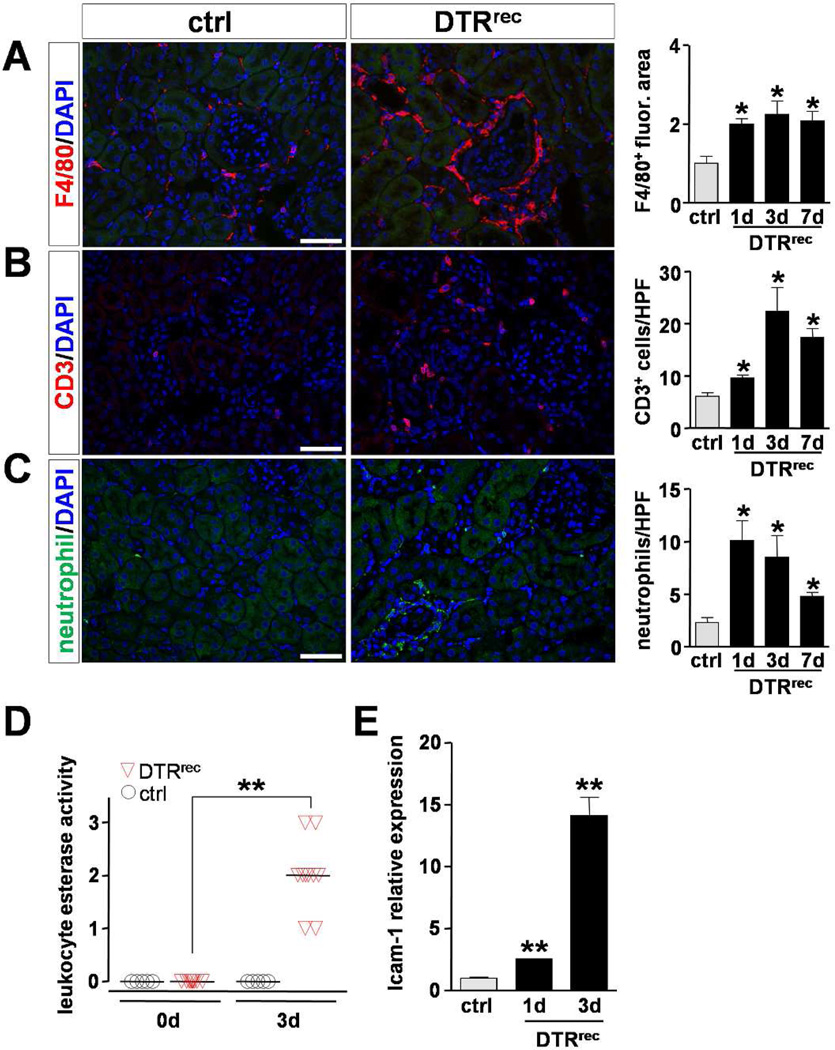
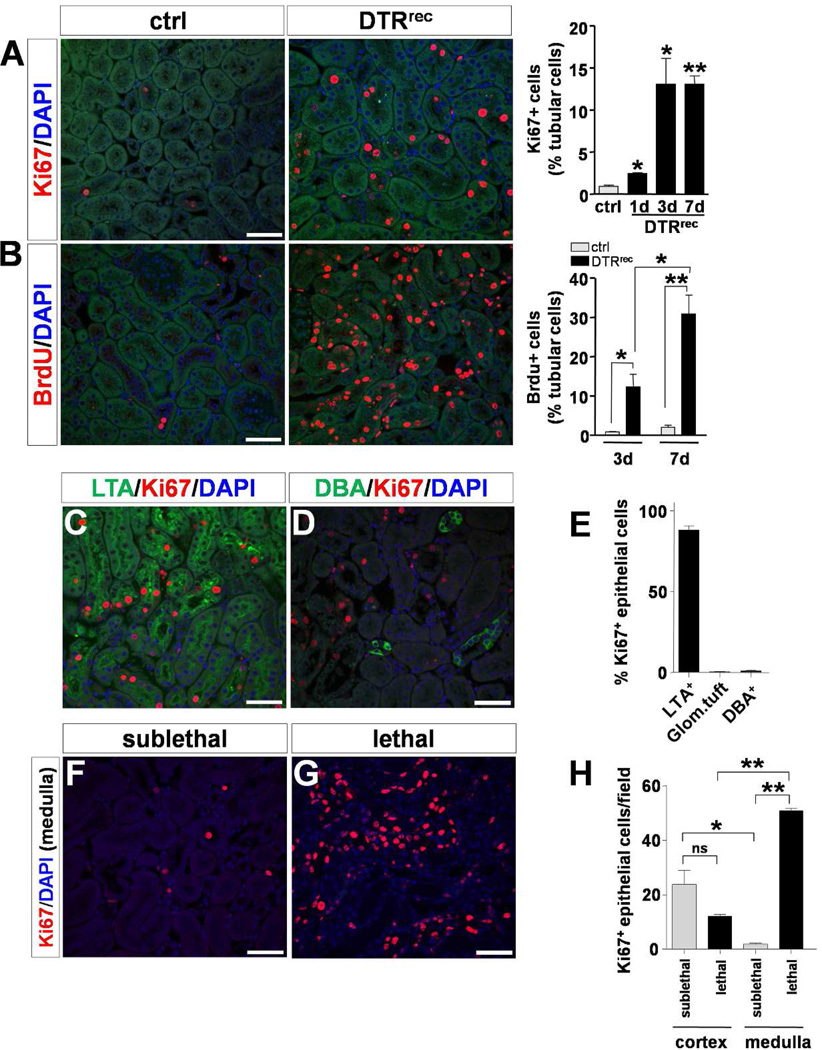
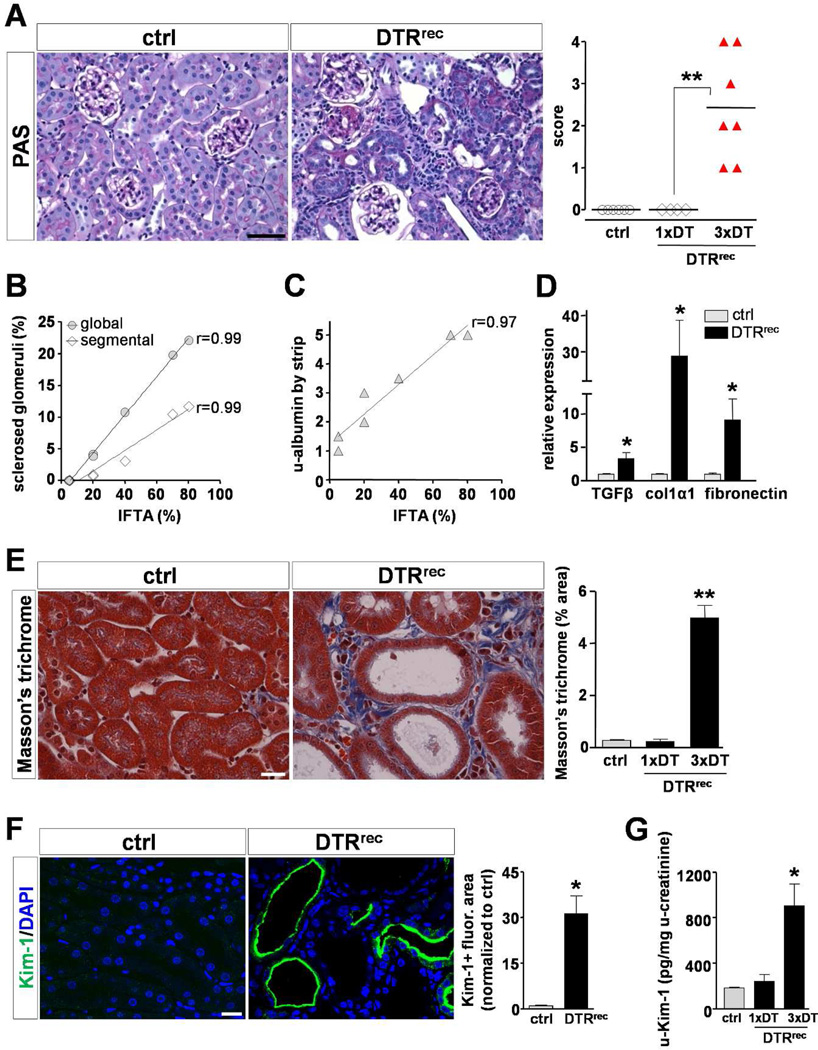
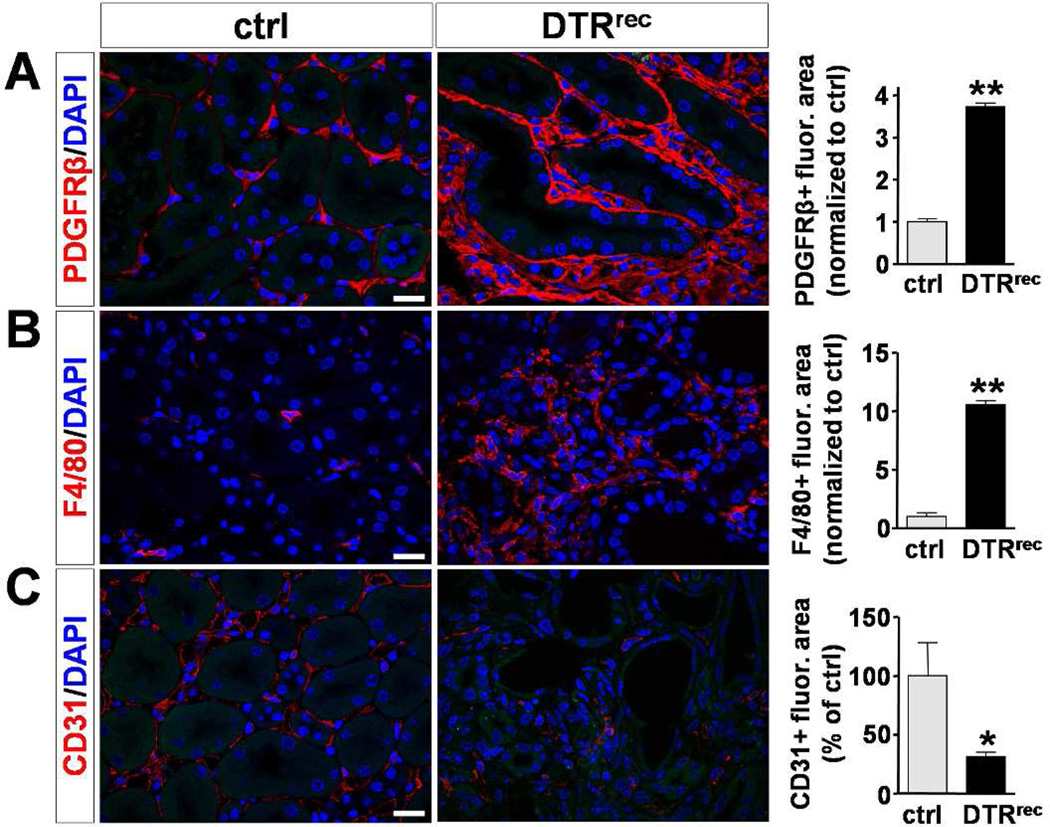
Chronic kidney disease (CKD) remains one of the leading causes of death in the developed world, and acute kidney injury (AKI) is now recognized as a major risk factor in its development. Understanding the factors leading to CKD after acute injury are limited by current animal models of AKI, which concurrently target various kidney cell types including epithelial, endothelial, and inflammatory cells. Here, we developed a mouse model of kidney injury using the Six2-Cre-LoxP technology to selectively activate expression of the simian diphtheria toxin (DT) receptor in renal epithelia derived from the metanephric mesenchyme. By adjusting the timing and dose of DT, a highly selective model of tubular injury was created to define the acute and chronic consequences of isolated epithelial injury. The DT-induced sublethal tubular epithelial injury was confined to the S1 and S2 segments of the proximal tubule rather than being widespread in the metanephric mesenchyme-derived epithelial lineage. Acute injury was promptly followed by inflammatory cell infiltration and robust tubular cell proliferation, leading to complete recovery after a single toxin insult. In striking contrast, three insults to renal epithelial cells at 1-week intervals resulted in maladaptive repair with interstitial capillary loss, fibrosis, and glomerulosclerosis, which was highly correlated with the degree of interstitial fibrosis. Thus, selective epithelial injury can drive the formation of interstitial fibrosis, capillary rarefaction, and potentially glomerulosclerosis, substantiating a direct role for damaged tubule epithelium in the pathogenesis of CKD.


Figures

Figure 1
Figure 1. Genetic approach rendering renal epithelial cells susceptible to diphtheria toxin (DT) and DT-induced AKI and survival in DTRrec mice
(A) In bigenic DTRrec mice, GFPCre expression is activated in Six2+ renal progenitor cells leading to excision of the loxP-STOP-loxP cassette and heritable induction of the simian diphtheria toxin receptor (DTR). (B) RT-PCR analysis demonstrates kidney-specific induction of DTR expression; n=3–4 for each data point; *P<0.01 vs. control. (C) Kaplan-Meier plot showing survival of DTRrec mice in relation to single DT dose. Doses ≤ 0.15 µg/kg bodyweight allow survival (P=0.001 [log-rank test for trend], P=0.014 [log-rank (Mantel-Cox) test]). (D) Serum creatinine as a function of time after DT administration; n=2–11 for each data point; *P<0.005, **P<0.0001. (E) Micrographs of an H&E stained DTRrec kidney section 3 days after DT (5µg/kg) injection at two different magnifications. Scale bars: 100µm; (*) proximal convoluted tubule, (#) straight portion of proximal tubule, (arrow) distal tubule, (arrow heads) collecting duct.
Figure 2
Figure 2. Sublethal DT dose confines acute tubular injury to segments S1/S2
(A) Representative micrographs of H&E stained kidney sections from DTRrec and littermate control 3 days after administration of 0.15µg/kg DT. Signs of acute epithelial cell injury are seen in DTRrec at the tubular pole, contiguous proximal tubule (S1 segment, *) and adjacent convoluted proximal tubules (S2 segment, #). Glomerular tuft, arteriole at the vascular pole and distal tubule (arrows) with macula densa appear normal. Scale bar: 50µm. (B) Scoring of acute tubular injury. Focal damage was defined as involvement of less than 50% and diffuse damage as involvement of 50% or more proximal tubules by acute tubular injury. Data points represent individual animals, horizontal lines represent mean values; *P<0.005, **P<0.00001. (C–G) Electron microscopy demonstrates selective injury of the proximal tubular epithelium with vacuolization and swelling of the cytoplasm, loss of brush border (F, arrow heads), luminal distension, attenuated epithelial lining, exposed tubular basement membrane (G, arrows), and cellular disruption, detachment (C&G, asterisks) and debris. By contrast, endothelial, mesangial and visceral epithelial (podocytes) cells of the glomerular tuft, intercalated (F, #) and principal cells of collecting duct, and interstitial cells show normal cellular details. Scale bars: 10µm. (H) This EM micrograph shows a single damaged proximal tubule epithelial cell captured in the process of disintegration. Of note, flanking epithelial cells appear unaffected (normal mitochondria, preserved brush border), underlining the concept of “toxin receptor mediated cell knockout” on a single cell level in this injury model. Scale bar: 2µm.
Figure 3
Figure 3. Selective induction of apoptosis in proximal tubule epithelium by sublethal dose of DT
(A–D) TUNEL labeling shows robust and specific DT-mediated induction of apoptosis in tubules of kidney cortex. Representative micrographs are shown at low (A, scale bar: 250µm) and high (B, scale bar: 25µm; # glomerular tuft) magnification. Quantitative analysis is presented in C and D; n=3–5 for each data point; *P<0.001. (E–G) Segment specific staining and quantification reveals that the vast majority of apoptotic epithelial cells (nuclear staining) are located in LTA+ proximal tubules (apical staining) and not found in glomerular tufts (#) or DBA+ collecting ducts (basolateral staining). Scale bars: 50µm, n=5 (see also Fig.S3). (H–J) Anti-Tamm Horsfall Protein (THP)/uromodulin immunostained sections show normal overall morphology of thick ascending limbs (TAL) in kidneys from sublethally DT-injured DTRrec animals (0.15µg/kg). By contrast, a large fraction of TAL segments shows overt morphological changes (flattening, cell sloughing) after administration of a lethal DT dose (0.25µg/kg) Scale bars: 50µm, n=4 per group; *P<0.0001. (K&L) Urinary Kim-1 and NGAL in DTRrec mice after DT (0.15µg/kg) injection; n=4–15 for each data point; *P<0.05. (M) Urinary protein analysis by chip-based capillary electrophoresis. Representative gel demonstrates transient appearance of higher molecular weight protein signal (arrow) consistent with albumin.
Figure 4
Figure 4. Targeted injury of proximal renal epithelium is followed by mild to moderate inflammatory response
(A–C) Analysis of inflammatory cell populations in kidney sections after DT administration. Left: Representative micrographs of immunostained kidney sections detecting macrophages (anti-F4/80), T cells (anti-CD3) and neutrophils (anti-neutrophil), respectively, 3 days after DT injection. Scale bars: 50µm. Right: Quantification of immunostained kidney sections. Fluorescence area was normalized to control; n=3–4 for each data point; *P<0.05 vs control. (D) Reagent strip-based estimate of urinary leukocyte esterase activity [1, small, 2, moderate, 3, large]. Data points represent individual animals, horizontal lines represent mean values; **P<0.00001. (E) Quantitative RT-PCR analysis shows upregulation of ICAM-1 expression in kidneys subsequent to DT-induced epithelial injury; n=3–5 for each data point; **P<0.001 vs control.
Figure 5
Figure 5. Regenerative response after acute DT-mediated injury to renal epithelium
(A) Cross sectional analysis of actively proliferating cells by anti-Ki67 staining. Left: Representative micrographs of kidney sections 3 days after DT exposure. Scale bar: 50µm. Right: Quantification of Ki67+ cells in kidney sections; n=3–5 for each data point; *P<0.05, **P<0.001 vs control. (B) Longitudinal proliferation assay by BrdU pulsing and labeling. Left: Representative micrographs of anti-BrdU immunostained kidney sections at day 7 after DT. Scale bar: 50µm. Right: Quantification of BrdU+ cells in kidney sections; n=3–5 for each data point; *P<0.05, **P<0.005. (C–E) Segment specific staining and quantification reveals that the majority of proliferating epithelial cells are located in LTA+ proximal tubules 3 days after administration of a sublethal DT dose. Scale bars: 50µm (see also Fig.S5). (F–H) In sublethally injured DTRrec kidneys the general prevalence of Ki67+ epithelial cells is higher in cortex than in medulla. Lethal DT doses lead to a reversal of this ratio mirroring the increased severity of damage to proximal tubules with fewer cells left to proliferate. Scale bars: 50µm, n=4–6 per group; *P<0.01, **P<0.0001.
Figure 6
Figure 6. Repeated injury to proximal tubular segments S1/S2 leads to development of tubulointerstitial fibrosis with secondary glomerulosclerosis
(A) Left: Representative micrographs of PAS stained kidney sections. Repeatedly injured DTRrec kidney shows signs of chronic tubulointerstitial injury including atrophic tubules and expanded tubulointerstitium. Scale bar: 50µm. Right: Scoring of chronic tubulointerstitial damage. Data points represent individual animals, horizontal lines represent mean values; **P<0.005. (B) Positive correlation between % interstitial fibrosis/tubular atrophy (IFTA) and number of globally or segmentally sclerosed glomeruli in these kidneys. Data points represent measurements of individual animals (n=7), lines represent best fits. (C) Positive correlation between % IFTA and albuminuria in these mice. (D) Quantitative RT-PCR analysis shows upregulation of TGFβ1, collagen 1α1 and fibronectin mRNA levels in repeatedly DT-injured kidneys; *P<0.05. (E) Assessment of extracellular matrix (ECM) deposition by Masson’s trichrome staining. Left: Representative micrographs of Masson’s trichrome stained kidney sections. Scale bar: 20µm. Right: Quantification of kidney area positive for ECM relative to total area; n=4–5 for each data point; *P<0.0001. (F) Staining of kidney sections with Kim-1-specific antibody. Left: Representative micrographs reveal pronounced expression of Kim-1 in tubules of fibrotic DTRrec kidneys after repeated DT treatment. Note abnormally dilated tubules and apical localization of Kim-1. Scale bar: 20µm. Right: Semi-automated quantitative analysis of Kim-1+ fluorescence area normalized to control. Values are shown as mean ± SEM, n=3–5 for each data point; *P<0.01. (G) ELISA-based quantification of Kim-1 in urine after single (1×) or repeated (3×) DT injection (0.15µg/kg). Consistent with Kim-1 staining, urinary Kim-1 was significantly higher in repeatedly injected DTRrec mice compared to littermate controls. By contrast, DTRrec animals with single DT exposure showed values comparable to those of control animals at 5 weeks. Data are given as mean ± SEM, n=3–5 for each data point; *P<0.05 vs. control.
Figure 7
Figure 7. Repeatedly injured DTRrec kidneys exhibit expansion of pericytes/perivascular fibroblasts and macrophages but decrease in capillary density
Immunostaining for specific cell markers and quantification. Left: Representative micrographs of kidney sections from repeatedly (3×) DT-treated (0.15µg/kg) DTRrec and control animals stained for PDGFRβ (pericytes/perivascular fibroblasts), F4/80 (macrophages) and CD31 (endothelial cells). Scale bars: 20µm. Right: Quantification of fluorescence area stained positive for PDGFRβ, F4/80 and CD31; n=3–5 for each data point; *P<0.05, **P<0.0001.

Comment in

References

    1. Thadhani R, Pascual M, Bonventre JV. Acute renal failure. N Engl J Med. 1996;334:1448–1460. - PubMed
    1. Chertow GM, Burdick E, Honour M, et al. Acute kidney injury, mortality, length of stay, and costs in hospitalized patients. J Am Soc Nephrol. 2005;16:3365–3370. - PubMed
    1. Hsu CY. Where is the epidemic in kidney disease? J Am Soc Nephrol. 2010;21:1607–1611. - PubMed
    1. Yang L, Besschetnova TY, Brooks CR, et al. Epithelial cell cycle arrest in G2/M mediates kidney fibrosis after injury. Nat Med. 2010;16:535–543. 531p following 143. - PMC - PubMed
    1. Okusa MD, Chertow GM, Portilla D. The nexus of acute kidney injury, chronic kidney disease, and World Kidney Day 2009. Clin J Am Soc Nephrol. 2009;4:520–522. - PMC - PubMed

Publication types

MeSH terms

Substances