. 2012 May;142(5):894-900.
doi: 10.3945/jn.111.156901. Epub 2012 Mar 21.

Changes in measurement procedure from a radioassay to a microbiologic assay necessitate adjustment of serum and RBC folate concentrations in the U.S. population from the NHANES 1988-2010

Affiliations

Changes in measurement procedure from a radioassay to a microbiologic assay necessitate adjustment of serum and RBC folate concentrations in the U.S. population from the NHANES 1988-2010

Christine M Pfeiffer et al. J Nutr. 2012 May.

Abstract

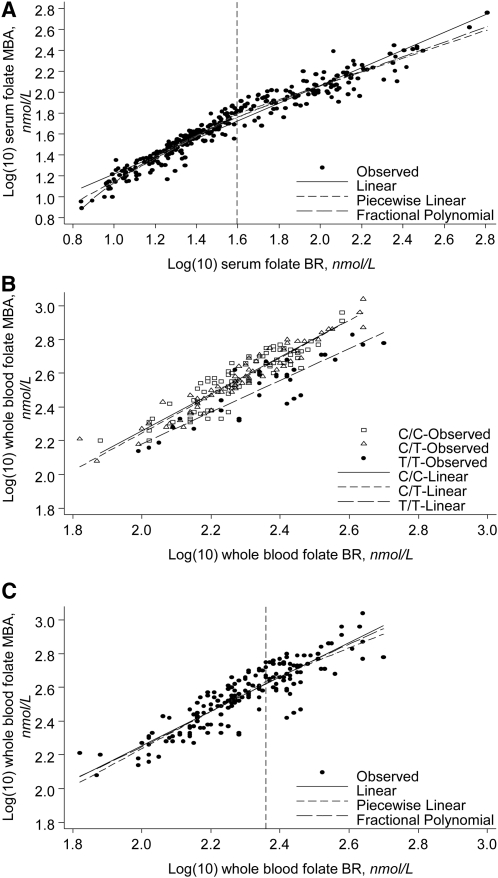
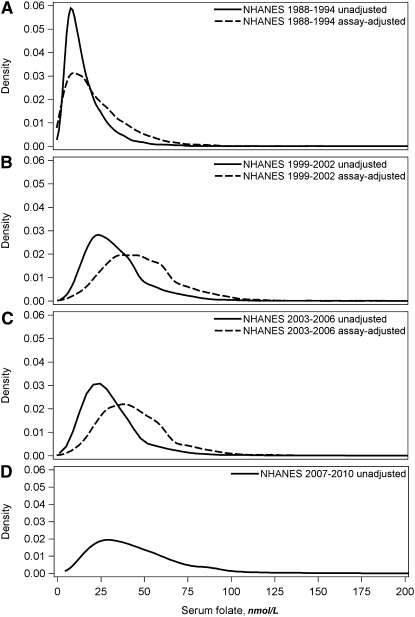
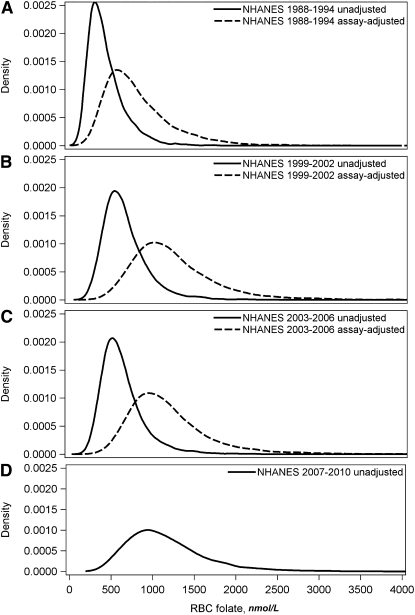
The NHANES measured serum and RBC folate concentrations by using a radioassay during prefortification (1988-1994) and postfortification (1999-2006) periods followed by the use of a microbiologic assay (MBA) from 2007-2010. The MBA produces higher concentrations than does the radioassay and is considered to be more accurate. To allow for accurate long-term trending (1988-2010), we evaluated different regression models (linear, piecewise linear, and fractional polynomial) to assay-adjust the radioassay results to be comparable to the MBA results. The data used to derive the regression models originated from 2 crossover studies in which the 2 assays were applied to a set of 325 serum and 171 whole-blood samples. Fractional polynomial regression of logarithmically transformed data provided the best fit for serum folate. Linear regression of logarithmically transformed whole-blood data provided an equally good fit compared with the other models and was the simplest to apply for RBC folate. Prefortification serum and RBC folate geometric mean concentrations increased after adjustment from 13.0 to 16.7 nmol/L and from 403 to 747 nmol/L, respectively. Postfortification serum folate concentrations increased from ~30 to ~43 nmol/L, and RBC folate concentrations increased from ~600 to ~1100 nmol/L after adjustment, with some variation across survey cycles. The presented regression equations allow the estimation of more accurate prevalence estimates and long-term trends in blood folate concentrations in the U.S. population by using results that are equivalent to the MBA. This information will be useful to public health officials in the United States who are dealing with folic acid fortification issues.


Conflict of interest statement

Author disclosures: C. M. Pfeiffer, J. P. Hughes, R. A. Durazo-Arvizu, D. A. Lacher, C. T. Sempos, M. Zhang, E. A. Yetley, and C. L. Johnson, no conflicts of interest.

Figures

FIGURE 1
FIGURE 1
Regression models for blood folate data generated by the BR and the MBA. (A) Finding the best fit for serum folate data in a convenience set of serum samples (n = 325) (4). The dashed vertical line represents the knot for the piecewise linear regression determined through a grid search (39 nmol/L). The correlation coefficients (R2) were as follows: linear, 0.94; piecewise linear, 0.95; and fractional polynomial, 0.95. The regression equations with x = log10BR and y = MBA were as follows: linear, y = 10**(0.847 · x + 0.372); piecewise linear, y = 10**(1.0847 · x + 0.0636) if x ≤1.595 and y = 10**(0.6591 · x + 0.7424) if x >1.595; and fractional polynomial, y = 10**(0.0188 · x3 – 2.7109 · x−1/2 + 3.8276). (B) Linear regression model showing the influence of MTHFR genotype on whole-blood folate in a convenience set of whole-blood samples (n = 171) (5). The correlation coefficients (R2) were as follows: C/C, 0.83; C/T, 0.92; and T/T, 0.80. The regression equations with x = log10BR and y = MBA were as follows: C/C, y = 10**(1.0937 · x + 0.0707); C/T, y = 10**(1.1137 · x + 0.0180); and T/T, y = 10**(0.9441 · x + 0.2924). (C) Finding the best fit for whole-blood folate data in a convenience set of whole-blood samples (n = 171) (4). The dashed vertical line represents the knot for the piecewise linear regression determined through a grid search (229 nmol/L). The correlation coefficients (R2) were as follows: linear, 0.80; piecewise linear, 0.80; and fractional polynomial, 0.80. The regression equations with x = log10BR and y = MBA were as follows: linear, y = 10**(1.0179 · x + 0.2175); piecewise linear, y = 10**(1.1108 · x + 0.0147) if x ≤2.36 and y = 10**(0.8216 · x + 0.6972) if x >2.36; and fractional polynomial, y = 10**(−15.4588 · x−2 * logex – 1.1317 · x−2 + 5.2092). Note: **designates exponential. BR, Bio-Rad radioassay; MBA, microbiologic assay.
FIGURE 2
FIGURE 2
Frequency distribution curves for unadjusted and assay-adjusted serum folate data for NHANES 1988–1994 (A; n = 23,361 unadjusted and 23,359 adjusted), for 1999–2002 (B; n = 15,653 unadjusted and adjusted), and for 2003–2006 (C; n = 15,331 unadjusted and adjusted) and for unadjusted data for NHANES 2007–2010 (D; n = 15,889). Adjustments were performed by regressing Bio-Rad radioassay data from 1988 to 1994 and from 1999 to 2006 to microbiologic assay–equivalent data.
FIGURE 3
FIGURE 3
Frequency distribution curves for unadjusted and assay-adjusted RBC folate data for NHANES 1988–1994 (A; n = 23,402 unadjusted and 22,846 adjusted), for 1999–2002 (B; n = 15,827 unadjusted and 15,613 adjusted), and for 2003–2006 (C; n = 15,451 unadjusted and 15,196 adjusted) and for unadjusted data for NHANES 2007–2010 (D; n = 15,951). Adjustments were made by regressing Bio-Rad radioassay data from 1988 to 1994 and from 1999 to 2006 to microbiologic assay–equivalent data.

References

    1. Yetley EA, Johnson CL. Folate and vitamin B-12 biomarkers in NHANES: history of their measurement and use. Am J Clin Nutr. 2011;94 Suppl:322S–31S - PMC - PubMed
    1. Yetley EA, Pfeiffer CM, Phinney KW, Fazili Z, Lacher DA, Bailey RL, Blackmore S, Bock JL, Brody LC, Carmel R, et al. Biomarkers of folate status in the National Health and Nutrition Examination Survey (NHANES): a roundtable summary. Am J Clin Nutr. 2011;94 Suppl:303S–12S - PMC - PubMed
    1. Raiten DJ, Fisher KD. Assessment of folate methodology used in the third National Health and Nutrition Examination Survey (NHANES III, 1988–1994). J Nutr. 1995;125:1371S–98S - PubMed
    1. Fazili Z, Pfeiffer CM, Zhang M. Comparison of serum folate species analyzed by LC-MS/MS with total folate measured by microbiologic assay and BioRad radioassay. Clin Chem. 2007;53:781–4 - PubMed
    1. Fazili Z, Pfeiffer CM, Zhang M, Jain RB, Koontz D. Influence of 5,10-methylene-tetrahydrofolate reductase polymorphism on whole blood folate concentrations measured by LC-MS/MS, microbiologic assay and BioRad radioassay. Clin Chem. 2008;54:197–201 - PubMed

Publication types

MeSH terms