. 2012 Nov 1;118(21):5320-30.
doi: 10.1002/cncr.27458. Epub 2012 Mar 21.

Intraoperative detection and removal of microscopic residual sarcoma using wide-field imaging

Affiliations
Free PMC article

Intraoperative detection and removal of microscopic residual sarcoma using wide-field imaging

Jeffrey K Mito et al. Cancer. .
Free PMC article

Abstract

Background: The goal of limb-sparing surgery for a soft tissue sarcoma of the extremity is to remove all malignant cells while preserving limb function. After initial surgery, microscopic residual disease in the tumor bed will cause a local recurrence in approximately 33% of patients with sarcoma. To help identify these patients, the authors developed an in vivo imaging system to investigate the suitability of molecular imaging for intraoperative visualization.

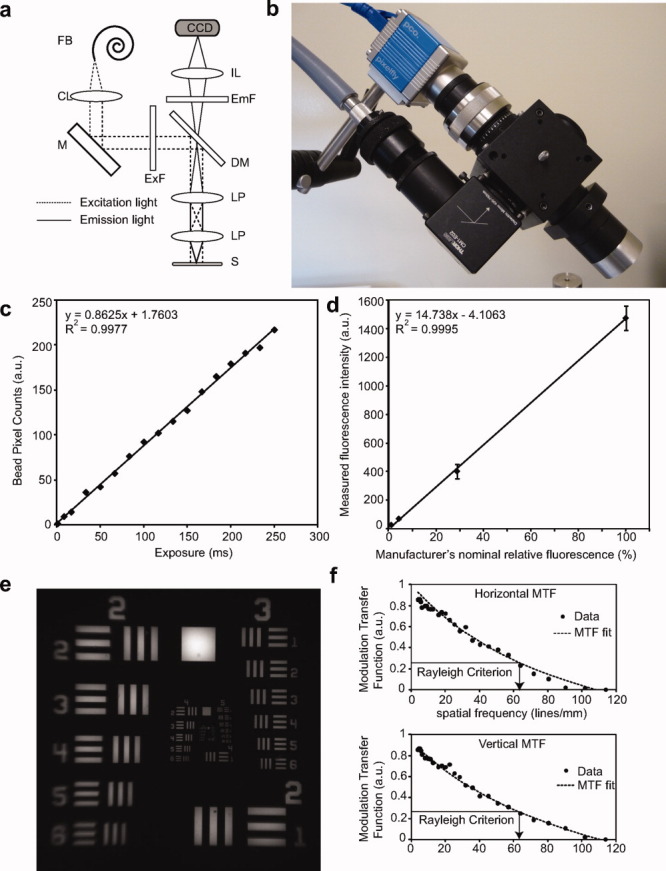
Methods: A primary mouse model of soft tissue sarcoma and a wide field-of-view imaging device were used to investigate a series of exogenously administered, near-infrared (NIR) fluorescent probes activated by cathepsin proteases for real-time intraoperative imaging.

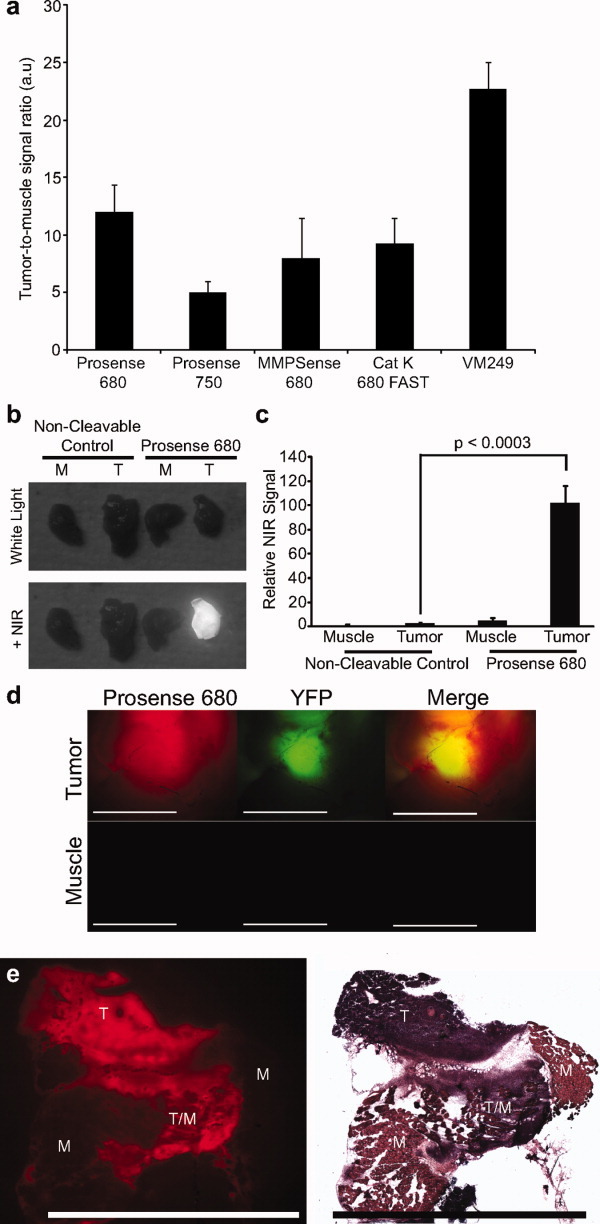
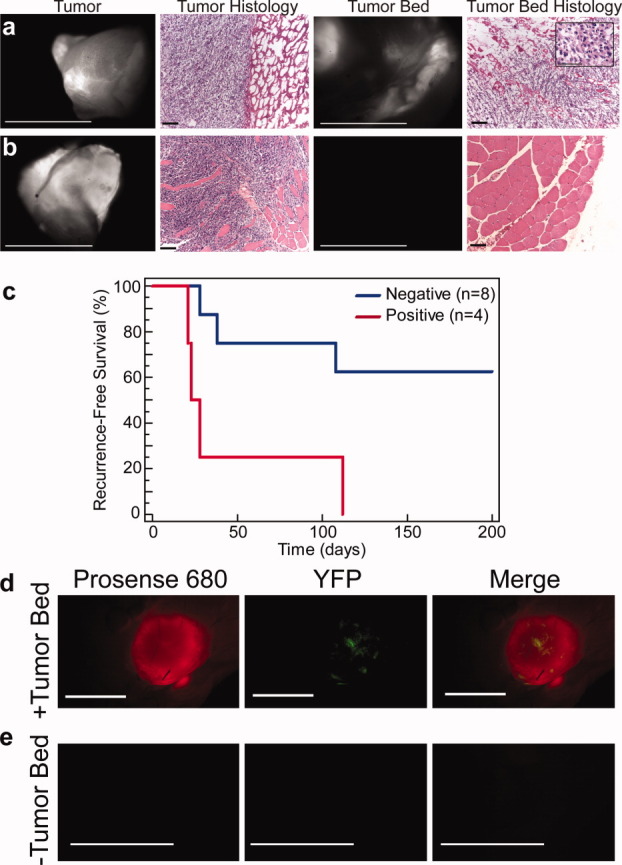
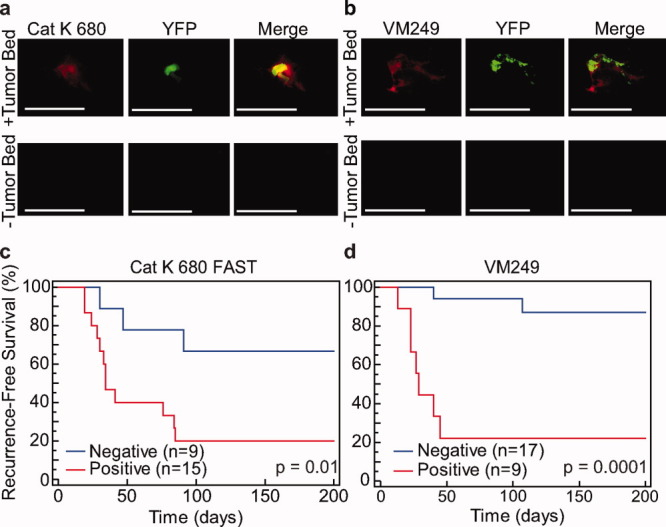
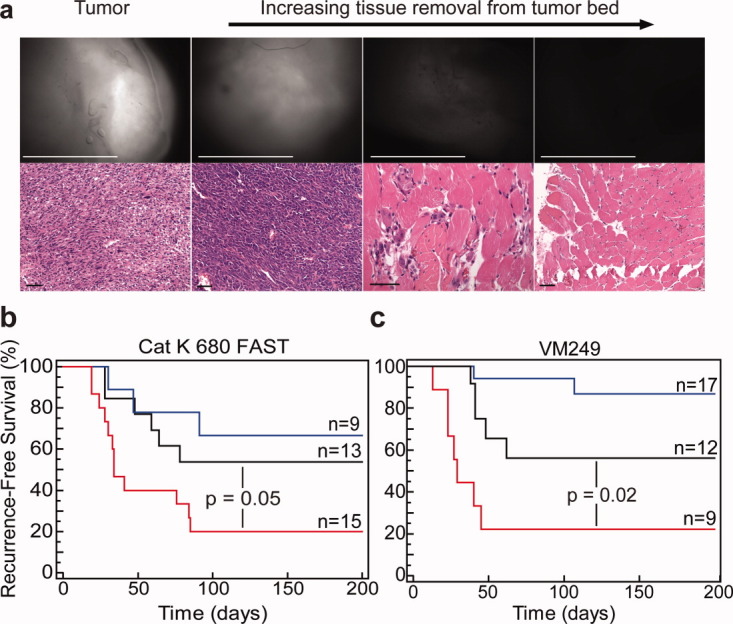
Results: The authors demonstrated that exogenously administered cathepsin-activated probes can be used for image-guided surgery to identify microscopic residual NIR fluorescence in the tumor beds of mice. The presence of residual NIR fluorescence was correlated with microscopic residual sarcoma and local recurrence. The removal of residual NIR fluorescence improved local control.

Conclusions: The authors concluded that their technique has the potential to be used for intraoperative image-guided surgery to identify microscopic residual disease in patients with cancer.


Figures

Figure 1
Figure 1
These images illustrate and characterize the prototype device. (a) Optical diagram of the intraoperative imaging device. A fiber bundle (FB) is connected to a light source and attaches to the device. A collimating lens (CL) collects the input light, and a mirror (M) reflects the light toward a band-pass excitation filter (ExF). A long-pass, dichroic mirror (DM) reflects the excitation light toward a lens-pair (LP) to illuminate the specimen (S). Fluorescence emission from the sample is transmitted through the DM and is spectrally filtered by a band-pass emission filter (EmF). An imaging lens (IL) focuses the fluorescence emission into a charge-coupled device (CCD). (b) Photograph of prototype imaging device. (c) Pixel intensities acquired from fluorescent microspheres imaged at different exposure times demonstrate a linear response of the device to exposure time (line fit). (d) Analysis indicated that the device had a linear response to 100-fold changes in intensity (line fit). Error bars indicate standard deviation from the mean. (e) Image of a standard US Air Force 1951 resolution target that was acquired with the imaging device to determine the spatial resolution of the system. (f) Horizontal and vertical contrast transfer functions are illustrated for the imaging system measured with the target image from e. The horizontal and vertical spatial frequency resolution limits are 62.8 and 63.0 cycles/mm, respectively. These correspond to approximately 16 μm of spatial resolution in both axes. MTF indicates modulation transfer function.
Figure 2
Figure 2
These images illustrate protease activation of near-infrared (NIR) imaging agents in autochthonous soft tissue sarcomas. (a) Fluorescence emission from sarcomas in mice injected with different probes (Prosense 680, Prosense 750, MMPSense 680, Cat K 680 FAST, and VM249) was compared with the normal in muscle from the same mouse. (b) Sarcoma-bearing mice injected with Prosense 680 or a noncleavable Prosense 680 control reveal that signal from the tumor tissue (T), but not from normal muscle (M), is observed with Prosense 680 when imaged under NIR light. (c) Fluorescence emission was quantified in sarcomas and normal muscle tissues from mice injected with Prosense 680 or a noncleavable Prosense 680 control. (d) Fluorescence imaging of a yellow fluorescent protein (YFP)-positive sarcoma after Prosense 680 injection shows that Prosense is activated in the sarcoma (tumor) but not in normal muscle from the contralateral limb. (e) Comparison of the fluorescence from Cat K 680 FAST in a frozen section with a section that was stained with H&E confirms the presence of tumor (T) in regions of high NIR fluorescence adjacent to normal muscle (M). Fluorescence imaging also detects areas of tumor invasion into normal muscle (T/M). Error bars represent standard deviation from the mean (scale bars = 5 mm).
Figure 3
Figure 3
These images illustrate the correlation of residual Prosense 680 fluorescence with microscopic residual sarcoma and local recurrence. (a,b) Primary sarcomas were removed by gross total resection from mice after Prosense 680 injection, and the excised tumors (Tumor) were imaged with the device and were correlated with the histologic presence of tumor (Tumor Histology). Then, the tumor bed was imaged, and residual fluorescence suggested (a) the presence or (b) absence of residual microscopic sarcoma (Tumor Bed). H&E staining of biopsies from the tumor beds shown in a and b confirmed the presence and absence of residual sarcoma cells in the tumor bed, respectively (Tumor Bed Histology). The inset in the far right corner in a is a ×100 magnification of the residual sarcoma cells. (c) Imaging residual near-infrared (NIR) fluorescence in the tumor bed after injection with Prosense 680 can risk-stratify mice for local recurrence (hazard ratio, 4.7; P = .013). Mice with primary sarcomas that expressed yellow fluorescent protein (YFP) also were injected with Prosense 680, and the tumors were resected. (d) In tumor beds that had levels of NIR fluorescence above the threshold, YFP-positive sarcoma cells were identified in the tumor bed; whereas (e), in tumor beds without residual NIR fluorescence, there were no YFP-positive sarcoma cells (scale bars = 5 mm in a [Tumor, Tumor Bed], b [Tumor, Tumor Bed], and e; 1 mm in d; 100 μm in a [Tumor Histology, Tumor Bed Histology] and b [Tumor Histology, Tumor Bed Histology]; and 50 μm in inset).
Figure 4
Figure 4
These images illustrate the correlation of residual fluorescence from the cathepsin K-specific Cat K 680 FAST probe and the multicathepsin imaging agent VM249 with microscopic residual sarcoma and local recurrence. Fluorescence imaging of mice with primary yellow fluorescent protein (YFP)-positive sarcomas injected with (a) Cat K 680 FAST or (b) VM249 reveal that the presence of residual near-infrared (NIR) fluorescence (+Tumor Bed) in the tumor bed is associated with residual YFP-positive tumor cells, whereas the absence of residual NIR fluorescence (−Tumor Bed) reveals no residual YFP-positive cells. Imaging residual fluorescence in the tumor bed after injection with (c) Cat K 680 FAST or (d) VM249 can risk-stratify mice for local recurrence (hazard ratio, 3.9 [P = .01] and 11.2 [P = .0001], respectively; scale bars = 5 mm).
Figure 5
Figure 5
Intraoperative, image-guided surgery improves local control. (a) Representative histology is shown from the removal of tumor using the imaging device. The top row corresponds to fluorescence images of the tumor (first column) and the tumor bed after 1, 2, and 3 resections (scale bars = 5 mm). The bottom row shows the corresponding histology from a biopsy of the tumor bed at each step in the surgery (scale bars = 50 μm). The removal of residual fluorescence from the tumor bed improves local control with either (b) the cathepsin K-specific Cat K 680 FAST probe or (c) the multicathepsin imaging agent VM249 (hazard ratio, 2.5 [P = .05] and 3.4 [P = .02]., respectively). Blue lines represent single resections with no residual near-infrared (NIR) fluorescence; red lines, single resections with residual NIR fluorescence; black lines, multiple resections to a tumor bed free of residual NIR fluorescence. Numbers of mice in each cohort are noted above each line. The single-positive and single-negative cohorts are the same groups illustrated in Figure 4c,d.

References

    1. Lewis JJ, Leung D, Casper ES, Woodruff J, Hajdu SI, Brennan MF. Multifactorial analysis of long-term follow-up (more than 5 years) of primary extremity sarcoma. Arch Surg. 1999;134:190–194. - PubMed
    1. Sabolch A, Feng M, Griffith K, et al. Risk factors for local recurrence and metastasis in soft tissue sarcomas of the extremity [published online ahead of print February 17, 2011] Am J Clin Oncol. 2011 - PubMed
    1. Sadoski C, Suit HD, Rosenberg A, Mankin H, Efird J. Preoperative radiation, surgical margins, and local control of extremity sarcomas of soft tissues. J Surg Oncol. 1993;52:223–230. - PubMed
    1. Lewis JJ, Leung D, Espat J, Woodruff JM, Brennan MF. Effect of reresection in extremity soft tissue sarcoma. Ann Surg. 2000;231:655–663. - PMC - PubMed
    1. Allweis TM, Kaufman Z, Lelcuk S, et al. A prospective, randomized, controlled, multicenter study of a real-time, intraoperative probe for positive margin detection in breast-conserving surgery. Am J Surg. 2008;196:483–489. - PubMed

Publication types

Substances