. 2012 May 11;287(20):16801-11.
doi: 10.1074/jbc.M112.354373. Epub 2012 Mar 21.

Multimode, cooperative mechanism of action of allosteric HIV-1 integrase inhibitors

Affiliations

Multimode, cooperative mechanism of action of allosteric HIV-1 integrase inhibitors

Jacques J Kessl et al. J Biol Chem. .

Abstract

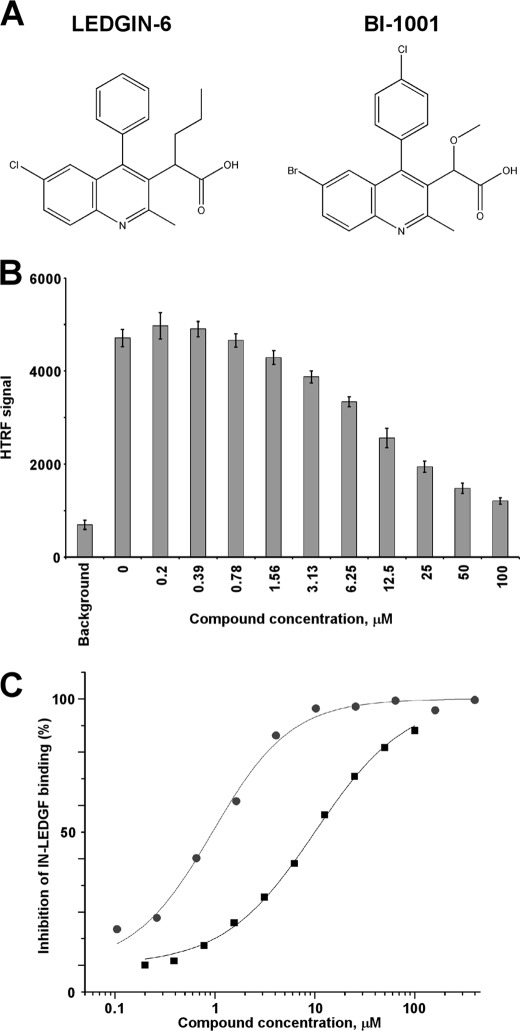
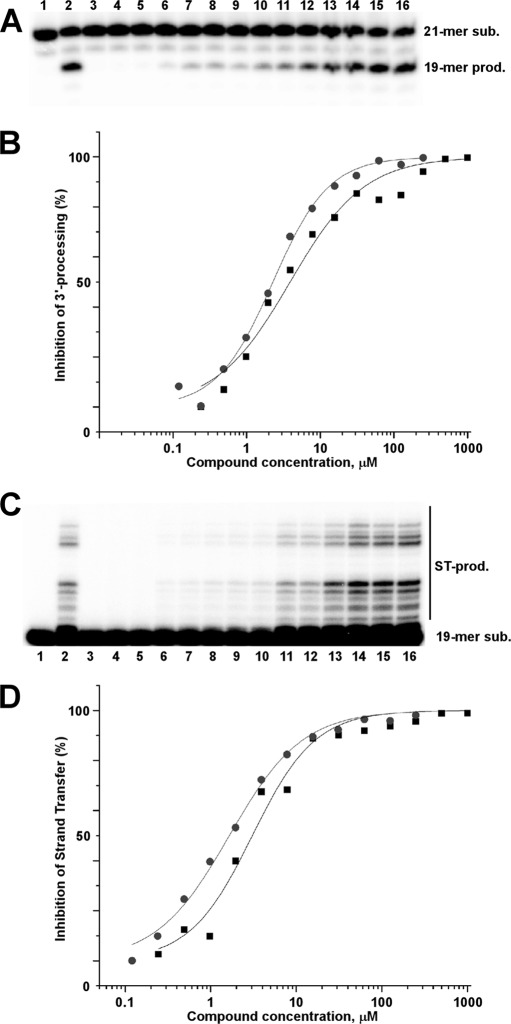
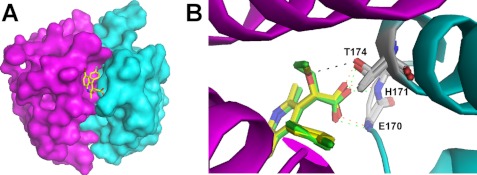
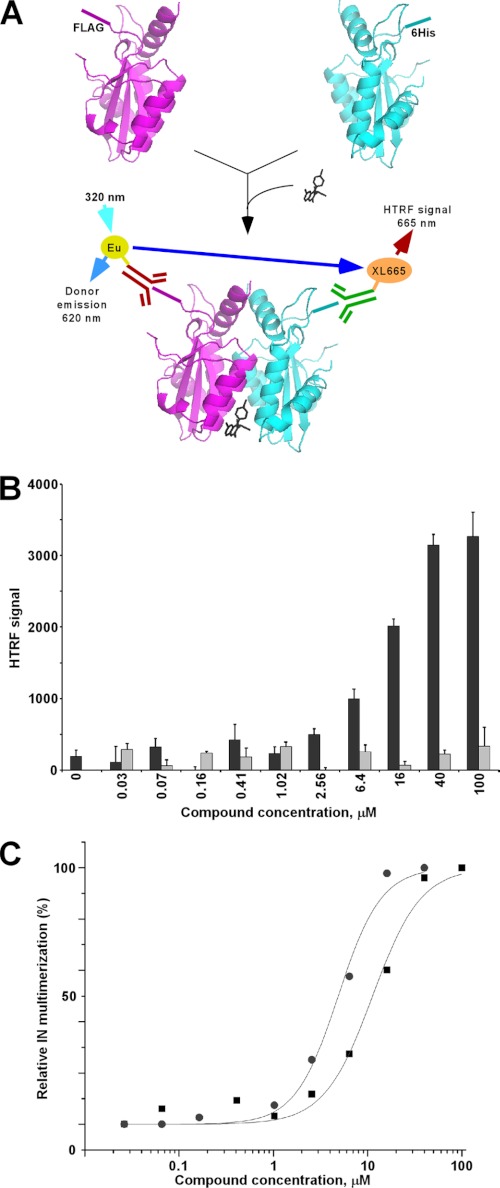
The multifunctional HIV-1 enzyme integrase interacts with viral DNA and its key cellular cofactor LEDGF to effectively integrate the reverse transcript into a host cell chromosome. These interactions are crucial for HIV-1 replication and present attractive targets for antiviral therapy. Recently, 2-(quinolin-3-yl) acetic acid derivatives were reported to selectively inhibit the integrase-LEDGF interaction in vitro and impair HIV-1 replication in infected cells. Here, we show that this class of compounds impairs both integrase-LEDGF binding and LEDGF-independent integrase catalytic activities with similar IC(50) values, defining them as bona fide allosteric inhibitors of integrase function. Furthermore, we show that 2-(quinolin-3-yl) acetic acid derivatives block the formation of the stable synaptic complex between integrase and viral DNA by allosterically stabilizing an inactive multimeric form of integrase. In addition, these compounds inhibit LEDGF binding to the stable synaptic complex. This multimode mechanism of action concordantly results in cooperative inhibition of the concerted integration of viral DNA ends in vitro and HIV-1 replication in cell culture. Our findings, coupled with the fact that high cooperativity of antiviral inhibitors correlates with their increased instantaneous inhibitory potential, an important clinical parameter, argue strongly that improved 2-(quinolin-3-yl) acetic acid derivatives could exhibit desirable clinical properties.


Figures

FIGURE 1.
FIGURE 1.
Effects of LEDGIN-6 and BI-1001 on the integrase-LEDGF binding. A, chemical structures of LEDGIN-6 and BI-1001. B, representative raw data of the inhibition dose response of LEDGIN-6 on the integrase-LEDGF interaction using the integrase-LEDGF HTRF assay. Each data point represents the mean of three independent experiments. C, curve fitting of dose-dependent inhibition of integrase-LEDGF binding by LEDGIN-6 (black squares) and BI-1001 (gray circles). The average values from three independent experiments are shown.
FIGURE 2.
FIGURE 2.
Effects of LEDGIN-6 and BI-1001 on integrase 3′-processing and strand transfer activities. A, a representative gel image for 3′-processing inhibition by LEDGIN-6. The 21-mer DNA substrate (sub.) and 19-mer reaction product (prod.) are indicated. Lane 1, DNA load; lane 2, DNA+integrase without inhibitor; lane 3, 25 mm EDTA was included in the reaction; the remaining lanes contained the following concentrations of LEDGIN-6. Lane 4, 1 mm; lane 5, 500 μm; lane 6, 250 μm; lane 7, 125 μm; lane 8, 62.5 μm; lane 9, 31.25 μm; lane 10, 15.6 μm; lane 11, 7.8 μm; lane 12, 3.9 μm; lane 13, 1.95 μm; lane 14, 977 nm; lane 15, 488 nm; lane 16, 240 nm. B, curve fitting of the dose-dependent inhibition of integrase 3′-processing activity by LEDGIN-6 (black squares) and BI-1001 (gray circles). The average values from three independent experiments are shown. C, a representative gel image for strand transfer inhibition by LEDGIN-6. The 19-mer DNA substrate and strand transfer (ST) products are indicated. Lane 1, DNA load; lane 2, DNA+integrase without inhibitor; lane 3, 25 mm EDTA was included in the reaction; the remaining lanes contained the following concentrations of LEDGIN-6. Lane 4, 1 mm; lane 5, 500 μm; lane 6, 250 μm; lane 7, 125 μm; lane 8, 62.5 μm; lane 9, 31.25 μm; lane 10, 15.6 μm; lane 11, 7.8 μm; lane 12, 3.9 μm; lane 13, 1.95 μm; lane 14, 977 nm; lane 15, 488 nm; lane 16, 240 nm. D, curve fitting of the dose-dependent inhibition of integrase strand transfer activity by LEDGIN-6 (black squares) and BI-1001 (gray circles). The average values from three independent experiments are shown.
FIGURE 3.
FIGURE 3.
Structural analysis of the inhibitor-CCD complexes. A, the crystal structure of BI-1001 bound to the integrase CCD dimer. Surface views of individual integrase subunits are depicted in magenta and cyan. B, overlay of CCD-LEDGIN-6 (Protein Data Bank code 3LPU) and CCD-BI-1001 co-crystal structures. Schematic views of integrase subunits are colored as described in A; LEDGIN-6 and BI-1001 backbones are green and yellow, respectively. Compound oxygen and nitrogen atoms, as well as those of integrase residues Thr-174, Glu-170, and His-171, are colored red and blue, respectively (for simplicity, only main chain Glu-170 and His-171 atoms are shown). The inhibitor carboxyl groups H-bond (green and orange dashed lines for LEDGIN-6 and BI-1001, respectively) with the main chain nitrogens of Glu-170 and His-171, and to the Thr-174 side chain. The BI-1001 methoxy group forms an additional H-bond (black dashed line) with Thr-174.
FIGURE 4.
FIGURE 4.
Effects of LEDGIN-6 and BI-1001 on integrase multimerization. A, HTRF assay design. The assay monitors the interaction between two integrase molecules: one containing His6 and the other containing the FLAG tag. The antibodies conjugated with Europium cryptate (Eu) and XL665 yield HTRF signal upon the protein-protein interaction. Europium cryptate is excited at 320 nm, and emissions at 665 and 620 nm are measured. The HTRF signal is calculated from the 665:620 nm ratio. B, representative raw data for affects of LEDGIN-6 (black bars) and raltegravir (gray bars) on integrase (IN) multimerization. Each data point represents the mean of three independent reactions. C, curve fittings of dose-response affects of LEDGIN-6 (black squares) and BI-1001 (gray circles) on integrase multimerization. The maximal HTRF signal, obtained at high compound concentrations, was set to 100%. The average values from three independent experiments are shown.
FIGURE 5.
FIGURE 5.
Effects of LEDGIN-6 and BI-1001 on integrase thermostability. A, representative raw data with LEDGIN-6 (black bars) and raltegravir (light bars). B, curve fitting of the dose-response effects of LEDGIN-6 (black squares) and BI-1001 (gray circles) on integrase (IN) thermostability. The average values from two independent experiments are shown. Temp., temperature.
FIGURE 6.
FIGURE 6.
Effects of LEDGIN-6 and BI-1001 on SSC formation (A) and the SSC-LEDGF interaction (B). A, SDS-PAGE analysis of SSCs. Lane 1, 1/10 of integrase (IN) load; lane 2, protein markers (MagicMark XP Western Protein Standard (Invitrogen)); lane 3, SSC assembly without compound; lane 4, SSC assembly with 100 μm LEDGIN-6; lane 5, SSC assembly with 200 μm LEDGIN-6; lane 6, SSC assembly with 100 μm BI-1001; lane 7, SSC assembly with 200 μm BI-1001. Integrase was visualized by Western blotting. B, SDS-PAGE analysis of LEDGF interactions with the SSC. Lane 1, 1/100 of LEDGF load; lane 2, SSC load; lane 3, protein markers (MagicMark XP Western Protein Standard (Invitrogen)); lane 4, SSC plus LEDGF; lane 5, SSC incubated with 100 μm LEDGIN-6 plus LEDGF; lane 6, SSC incubated with 200 μm LEDGIN-6 plus LEDGF. Integrase and LEDGF were visualized by Western blot.
FIGURE 7.
FIGURE 7.
Effects of LEDGIN-6 and BI-1001 on integrase concerted integration activity. A, representative raw data of the inhibition dose response of LEDGIN-6 on LEDGF-dependent concerted integration activity. Positions of supercoiled (SC) target and 32-mer donor DNA substrates as well as half-site (HS) and full-site (FS) integration products are indicated. Lane 1, DNA markers (BIOLINE Quanti-Marker, 1 kb); lane 2, target DNA load; lane 3, integrase activities in the presence of LEDGF and target DNA and donor DNA substrates. The remaining lanes contained the following concentrations of LEDGIN-6: lane 4, 1 mm; lane 5, 500 μm; lane 6, 250 μm; lane 7, 125 μm; lane 8, 62.5 μm; lane 9, 31.25 μm; lane 10, 15.6 μm; lane 11, 7.8 μm; lane 12, 3.9 μm; lane 13, 1.95 μm; lane 14, 977 nm; lane 15, 488 nm; lane 16, 240 nm. Curve fitting of the inhibition dose responses of LEDGIN-6 (black squares) and BI-1001 (gray circles) on LEDGF-dependent concerted integration activity. The average values from two independent experiments are shown.
FIGURE 8.
FIGURE 8.
Dose-response curves of antiviral activities of saquinavir, raltegravir, LEDGIN-6, and BI-1001. The average values from two to three independent experiments are indicated. RAL, raltegravir; SQV, saquinavir.

References

    1. Johnson A. A., Marchand C., Pommier Y. (2004) HIV-1 integrase inhibitors: A decade of research and two drugs in clinical trial. Curr. Top Med. Chem. 4, 1059–1077 - PubMed
    1. Brown P. O. (1997) in Retroviruses (Coffin J. M., Hughes S. H., Varmus H. E., eds), pp. 161–204, Cold Spring Harbor Laboratory, Plainview, NY
    1. Murray J. M., Emery S., Kelleher A. D., Law M., Chen J., Hazuda D. J., Nguyen B. Y., Teppler H., Cooper D. A. (2007) Antiretroviral therapy with the integrase inhibitor raltegravir alters decay kinetics of HIV, significantly reducing the second phase. Aids 21, 2315–2321 - PubMed
    1. Malet I., Delelis O., Valantin M. A., Montes B., Soulie C., Wirden M., Tchertanov L., Peytavin G., Reynes J., Mouscadet J. F., Katlama C., Calvez V., Marcelin A. G. (2008) Mutations associated with failure of raltegravir treatment affect integrase sensitivity to the inhibitor in vitro. Antimicrob Agents Chemother 52, 1351–1358 - PMC - PubMed
    1. Kessl J. J., Eidahl J. O., Shkriabai N., Zhao Z., McKee C. J., Hess S., Burke T. R., Jr., Kvaratskhelia M. (2009) An allosteric mechanism for inhibiting HIV-1 integrase with a small molecule. Mol. Pharmacol. 76, 824–832 - PMC - PubMed

Publication types

MeSH terms

LinkOut - more resources