. 2012 May;263(2):451-60.
doi: 10.1148/radiol.12111593. Epub 2012 Mar 21.

Demyelinating diseases: myeloperoxidase as an imaging biomarker and therapeutic target

Affiliations

Demyelinating diseases: myeloperoxidase as an imaging biomarker and therapeutic target

Reza Forghani et al. Radiology. 2012 May.

Abstract

Purpose: To evaluate myeloperoxidase (MPO) as a newer therapeutic target and bis-5-hydroxytryptamide-diethylenetriaminepentaacetate-gadolinium (Gd) (MPO-Gd) as an imaging biomarker for demyelinating diseases such as multiple sclerosis (MS) by using experimental autoimmune encephalomyelitis (EAE), a murine model of MS.

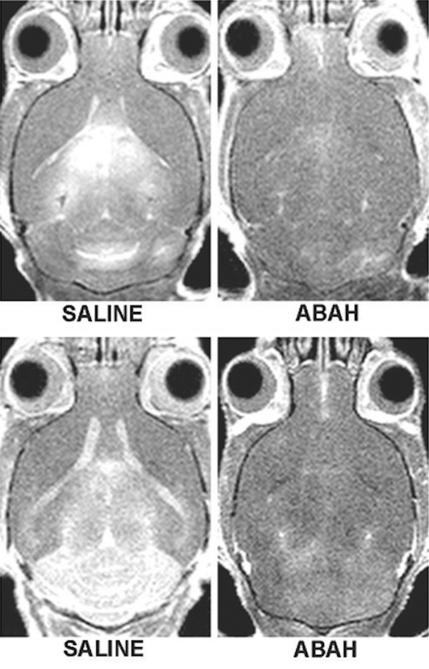
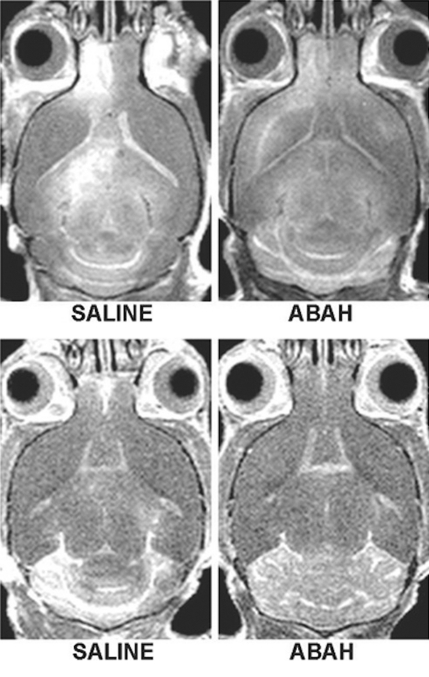
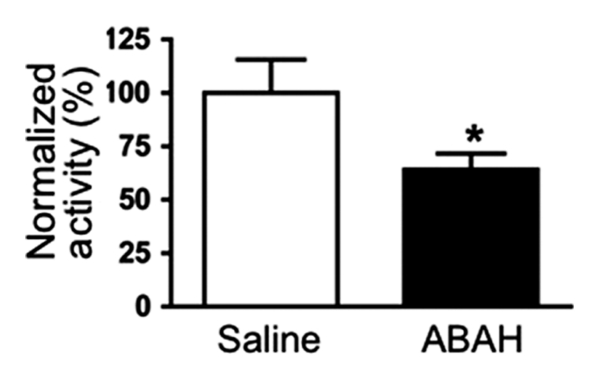
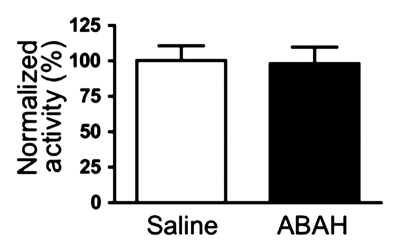
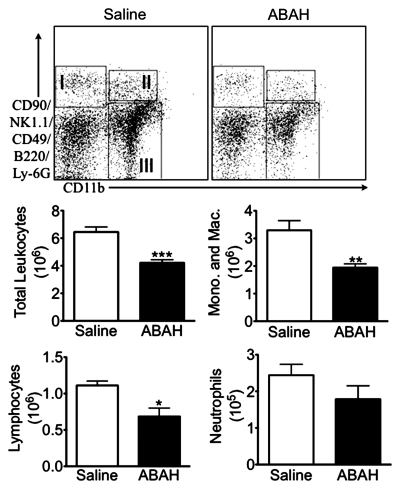
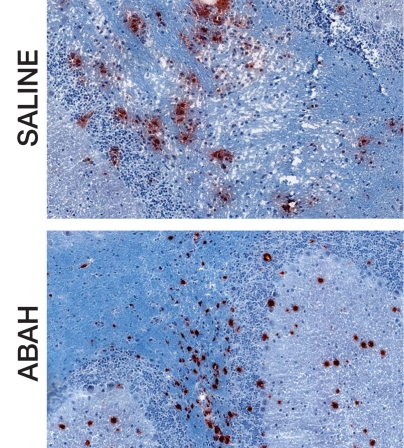
Materials and methods: Animal experiments were approved by the institutional animal care committee. EAE was induced in SJL mice by using proteolipid protein (PLP), and mice were treated with either 4-aminobenzoic acid hydrazide (ABAH), 40 mg/kg injected intraperitoneally, an irreversible inhibitor of MPO, or saline as control, and followed up to day 40 after induction. In another group of SJL mice, induction was performed without PLP as shams. The mice were imaged by using MPO-Gd to track changes in MPO activity noninvasively. Imaging results were corroborated by enzymatic assays, flow cytometry, and histopathologic analyses. Significance was computed by using the t test or Mann-Whitney U test.

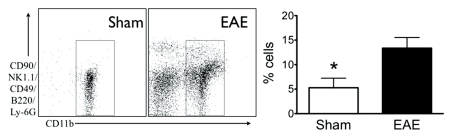
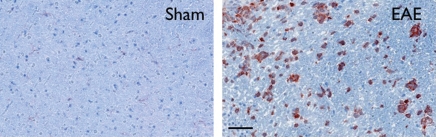
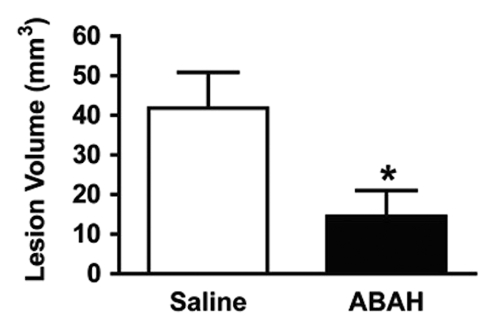
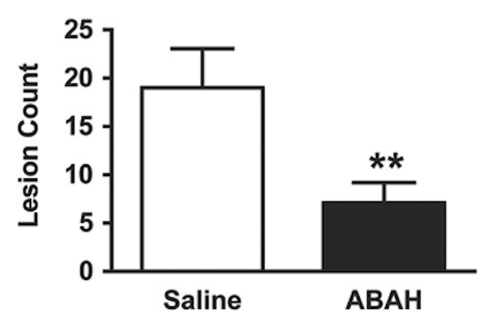
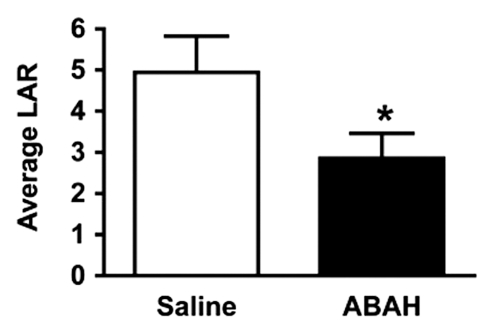
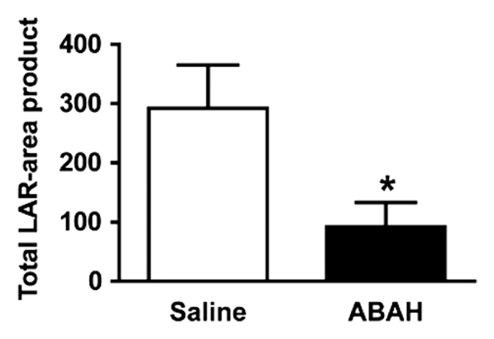
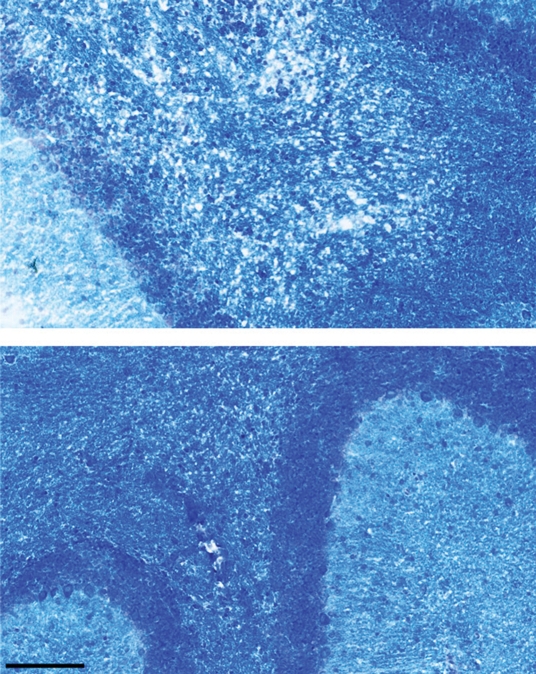
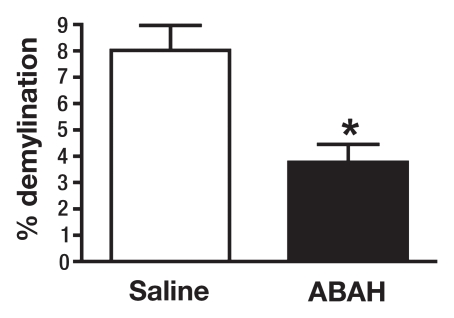
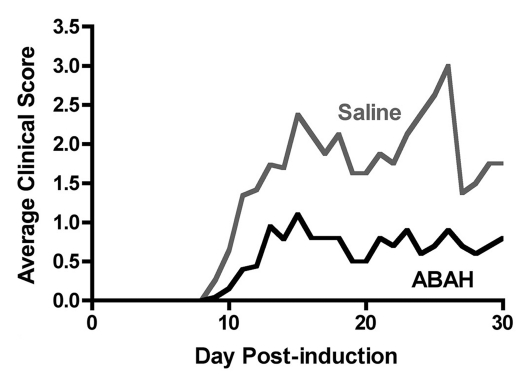
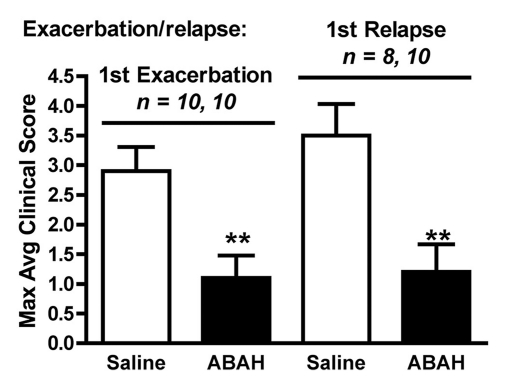
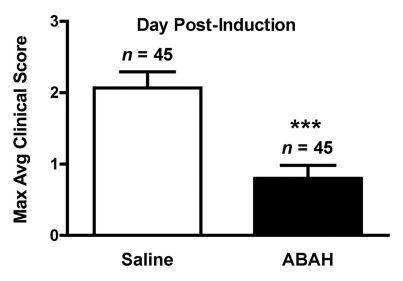
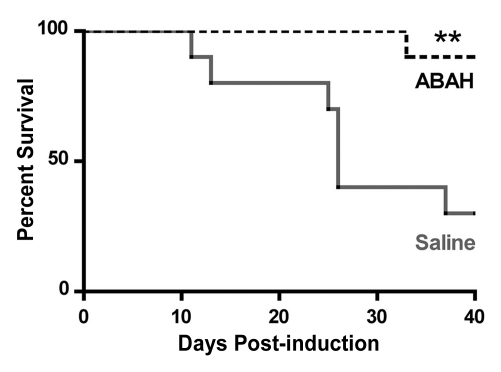
Results: There was a 2.5-fold increase in myeloid cell infiltration in the brain (P = .026), with a concomitant increase in brain MPO level (P = .0087). Inhibiting MPO activity with ABAH resulted in decrease in MPO-Gd-positive lesion volume (P = .012), number (P = .009), and enhancement intensity (P = .03) at MR imaging, reflecting lower local MPO activity (P = .03), compared with controls. MPO inhibition was accompanied by decreased demyelination (P = .01) and lower inflammatory cell recruitment in the brain (P < .0001), suggesting a central MPO role in inflammatory demyelination. Clinically, MPO inhibition significantly reduced the severity of clinical symptoms (P = .0001) and improved survival (P = .0051) in mice with EAE.

Conclusion: MPO may be a key mediator of myeloid inflammation and tissue damage in EAE. Therefore, MPO could represent a promising therapeutic target, as well as an imaging biomarker, for demyelinating diseases and potentially for other diseases in which MPO is implicated.


Figures

Figure 1a:
Figure 1a:
Increase in myeloid cells in brains of mice with EAE. (a) Left: Analysis from flow cytometry data shows a greater than twofold increase in myeloid cells in the brains of mice with EAE (n = 17) induced with proteolipid protein compared with sham control mice (n = 7). Right: Representative flow cytometry plots. * = P < .05. Error bars = standard error. (b) Representative immunohistochemical sections demonstrate markedly increased number of CD11b-positive cells in the brain of mice with EAE but not in the brain of sham control mice. Bar = 50 mm. (CD11b stain; original magnification, ×400.)
Figure 1b:
Figure 1b:
Increase in myeloid cells in brains of mice with EAE. (a) Left: Analysis from flow cytometry data shows a greater than twofold increase in myeloid cells in the brains of mice with EAE (n = 17) induced with proteolipid protein compared with sham control mice (n = 7). Right: Representative flow cytometry plots. * = P < .05. Error bars = standard error. (b) Representative immunohistochemical sections demonstrate markedly increased number of CD11b-positive cells in the brain of mice with EAE but not in the brain of sham control mice. Bar = 50 mm. (CD11b stain; original magnification, ×400.)
Figure 2a:
Figure 2a:
In vivo molecular MR imaging in mice with EAE. (a) Representative brain images demonstrate variable but extensive MPO-specific enhancing areas in the brains of mice with EAE that are decreased with MPO inhibition by using ABAH. (b) Images illustrate the changes to lesion enhancement intensity and were selected on the basis of similar lesion areas to compare the intensity of lesion enhancement, which is also markedly reduced in ABAH-treated mice with EAE compared with saline-treated mice with EAE. Each image represents the brain of a different mouse. Graphs show that the qualitative observations were confirmed quantitatively (n = 10 per group) with a significantly reduced MPO-specific (c) total lesion volume, (d) total lesion count, (e) LAR, and (f) total LAR-area product. * = P < .05, ** = P < .01, error bars = standard error.
Figure 2b:
Figure 2b:
In vivo molecular MR imaging in mice with EAE. (a) Representative brain images demonstrate variable but extensive MPO-specific enhancing areas in the brains of mice with EAE that are decreased with MPO inhibition by using ABAH. (b) Images illustrate the changes to lesion enhancement intensity and were selected on the basis of similar lesion areas to compare the intensity of lesion enhancement, which is also markedly reduced in ABAH-treated mice with EAE compared with saline-treated mice with EAE. Each image represents the brain of a different mouse. Graphs show that the qualitative observations were confirmed quantitatively (n = 10 per group) with a significantly reduced MPO-specific (c) total lesion volume, (d) total lesion count, (e) LAR, and (f) total LAR-area product. * = P < .05, ** = P < .01, error bars = standard error.
Figure 2c:
Figure 2c:
In vivo molecular MR imaging in mice with EAE. (a) Representative brain images demonstrate variable but extensive MPO-specific enhancing areas in the brains of mice with EAE that are decreased with MPO inhibition by using ABAH. (b) Images illustrate the changes to lesion enhancement intensity and were selected on the basis of similar lesion areas to compare the intensity of lesion enhancement, which is also markedly reduced in ABAH-treated mice with EAE compared with saline-treated mice with EAE. Each image represents the brain of a different mouse. Graphs show that the qualitative observations were confirmed quantitatively (n = 10 per group) with a significantly reduced MPO-specific (c) total lesion volume, (d) total lesion count, (e) LAR, and (f) total LAR-area product. * = P < .05, ** = P < .01, error bars = standard error.
Figure 2d:
Figure 2d:
In vivo molecular MR imaging in mice with EAE. (a) Representative brain images demonstrate variable but extensive MPO-specific enhancing areas in the brains of mice with EAE that are decreased with MPO inhibition by using ABAH. (b) Images illustrate the changes to lesion enhancement intensity and were selected on the basis of similar lesion areas to compare the intensity of lesion enhancement, which is also markedly reduced in ABAH-treated mice with EAE compared with saline-treated mice with EAE. Each image represents the brain of a different mouse. Graphs show that the qualitative observations were confirmed quantitatively (n = 10 per group) with a significantly reduced MPO-specific (c) total lesion volume, (d) total lesion count, (e) LAR, and (f) total LAR-area product. * = P < .05, ** = P < .01, error bars = standard error.
Figure 2e:
Figure 2e:
In vivo molecular MR imaging in mice with EAE. (a) Representative brain images demonstrate variable but extensive MPO-specific enhancing areas in the brains of mice with EAE that are decreased with MPO inhibition by using ABAH. (b) Images illustrate the changes to lesion enhancement intensity and were selected on the basis of similar lesion areas to compare the intensity of lesion enhancement, which is also markedly reduced in ABAH-treated mice with EAE compared with saline-treated mice with EAE. Each image represents the brain of a different mouse. Graphs show that the qualitative observations were confirmed quantitatively (n = 10 per group) with a significantly reduced MPO-specific (c) total lesion volume, (d) total lesion count, (e) LAR, and (f) total LAR-area product. * = P < .05, ** = P < .01, error bars = standard error.
Figure 2f:
Figure 2f:
In vivo molecular MR imaging in mice with EAE. (a) Representative brain images demonstrate variable but extensive MPO-specific enhancing areas in the brains of mice with EAE that are decreased with MPO inhibition by using ABAH. (b) Images illustrate the changes to lesion enhancement intensity and were selected on the basis of similar lesion areas to compare the intensity of lesion enhancement, which is also markedly reduced in ABAH-treated mice with EAE compared with saline-treated mice with EAE. Each image represents the brain of a different mouse. Graphs show that the qualitative observations were confirmed quantitatively (n = 10 per group) with a significantly reduced MPO-specific (c) total lesion volume, (d) total lesion count, (e) LAR, and (f) total LAR-area product. * = P < .05, ** = P < .01, error bars = standard error.
Figure 3a:
Figure 3a:
Biochemical analyses in mice with EAE. (a) Graph shows reduced extracellular peroxidase activity in ABAH-treated mice with EAE (n = 9) compared with saline-treated control mice with EAE (n = 11). (b) Graph shows no significant change in the activity from the intracellular fraction, indicating that only secreted extracellular MPO was inhibited by ABAH. Absolute value of the intracellular peroxidase specific activity was approximately 10 times lower than that of the extracellular fraction, because most of the stored nonsecreted MPO was in the inactive form. (c) Top: Representative flow cytometry plots. Bottom: Analysis from flow cytometry shows decrease in total number of leukocytes, including monocytes (Mono.) and macrophages and microglia (Mac.), and lymphocytes in brains of ABAH-treated mice with EAE compared with saline-treated control mice with EAE (n = 10 per group). I = lymphocytes, II = neutrophils, III = monocytes/macrophages/microglia, * = P < .05, ** = P < .01, *** = P < .001, error bars = standard error.
Figure 3b:
Figure 3b:
Biochemical analyses in mice with EAE. (a) Graph shows reduced extracellular peroxidase activity in ABAH-treated mice with EAE (n = 9) compared with saline-treated control mice with EAE (n = 11). (b) Graph shows no significant change in the activity from the intracellular fraction, indicating that only secreted extracellular MPO was inhibited by ABAH. Absolute value of the intracellular peroxidase specific activity was approximately 10 times lower than that of the extracellular fraction, because most of the stored nonsecreted MPO was in the inactive form. (c) Top: Representative flow cytometry plots. Bottom: Analysis from flow cytometry shows decrease in total number of leukocytes, including monocytes (Mono.) and macrophages and microglia (Mac.), and lymphocytes in brains of ABAH-treated mice with EAE compared with saline-treated control mice with EAE (n = 10 per group). I = lymphocytes, II = neutrophils, III = monocytes/macrophages/microglia, * = P < .05, ** = P < .01, *** = P < .001, error bars = standard error.
Figure 3c:
Figure 3c:
Biochemical analyses in mice with EAE. (a) Graph shows reduced extracellular peroxidase activity in ABAH-treated mice with EAE (n = 9) compared with saline-treated control mice with EAE (n = 11). (b) Graph shows no significant change in the activity from the intracellular fraction, indicating that only secreted extracellular MPO was inhibited by ABAH. Absolute value of the intracellular peroxidase specific activity was approximately 10 times lower than that of the extracellular fraction, because most of the stored nonsecreted MPO was in the inactive form. (c) Top: Representative flow cytometry plots. Bottom: Analysis from flow cytometry shows decrease in total number of leukocytes, including monocytes (Mono.) and macrophages and microglia (Mac.), and lymphocytes in brains of ABAH-treated mice with EAE compared with saline-treated control mice with EAE (n = 10 per group). I = lymphocytes, II = neutrophils, III = monocytes/macrophages/microglia, * = P < .05, ** = P < .01, *** = P < .001, error bars = standard error.
Figure 4a:
Figure 4a:
MPO inhibition results in decreased tissue damage and demyelination. (a) Immunohistochemical sections selected for areas with a similar degree of MPO-positive cell infiltration in saline-treated and ABAH-treated mice with EAE (MPO stain), but (b) adjacent sections demonstrate less demyelination in the ABAH-treated mice with EAE (Luxol fast blue stain). Bar = 50 mm. (Original magnification, ×400.) (c) Graph shows significantly less demyelination in ABAH-treated mice with EAE compared with saline-treated mice with EAE (six mice, three in each group, total of 27 sections evaluated). Mann-Whitney U test was used. * = P < .05, error bars = standard error.
Figure 4b:
Figure 4b:
MPO inhibition results in decreased tissue damage and demyelination. (a) Immunohistochemical sections selected for areas with a similar degree of MPO-positive cell infiltration in saline-treated and ABAH-treated mice with EAE (MPO stain), but (b) adjacent sections demonstrate less demyelination in the ABAH-treated mice with EAE (Luxol fast blue stain). Bar = 50 mm. (Original magnification, ×400.) (c) Graph shows significantly less demyelination in ABAH-treated mice with EAE compared with saline-treated mice with EAE (six mice, three in each group, total of 27 sections evaluated). Mann-Whitney U test was used. * = P < .05, error bars = standard error.
Figure 4c:
Figure 4c:
MPO inhibition results in decreased tissue damage and demyelination. (a) Immunohistochemical sections selected for areas with a similar degree of MPO-positive cell infiltration in saline-treated and ABAH-treated mice with EAE (MPO stain), but (b) adjacent sections demonstrate less demyelination in the ABAH-treated mice with EAE (Luxol fast blue stain). Bar = 50 mm. (Original magnification, ×400.) (c) Graph shows significantly less demyelination in ABAH-treated mice with EAE compared with saline-treated mice with EAE (six mice, three in each group, total of 27 sections evaluated). Mann-Whitney U test was used. * = P < .05, error bars = standard error.
Figure 5a:
Figure 5a:
Graphs show that MPO inhibition improves clinical symptoms and survival of mice with EAE. (a) Average clinical scores from 45 control saline-treated and 45 ABAH-treated mice with EAE demonstrate reduced disease exacerbation. (b) Significantly decreased maximum average clinical score was observed in the treated group during the first exacerbation and first relapse (10 saline-treated mice, 10 ABAH-treated mice) followed up to day 40. Error bars = standard error. (c) Maximum average clinical score in all 90 mice is also significantly decreased in the ABAH-treated group. Because some mice were analyzed before peak clinical disease, the average scores were slightly lower than shown in b. Error bars = standard error. (d) Of 20 mice followed up to day 40, only three of 10 control mice survived to day 40 compared with nine of 10 in the treated group. Additional information is provided in Figure E2 (online). ** = P < .01, *** = P < .001.
Figure 5b:
Figure 5b:
Graphs show that MPO inhibition improves clinical symptoms and survival of mice with EAE. (a) Average clinical scores from 45 control saline-treated and 45 ABAH-treated mice with EAE demonstrate reduced disease exacerbation. (b) Significantly decreased maximum average clinical score was observed in the treated group during the first exacerbation and first relapse (10 saline-treated mice, 10 ABAH-treated mice) followed up to day 40. Error bars = standard error. (c) Maximum average clinical score in all 90 mice is also significantly decreased in the ABAH-treated group. Because some mice were analyzed before peak clinical disease, the average scores were slightly lower than shown in b. Error bars = standard error. (d) Of 20 mice followed up to day 40, only three of 10 control mice survived to day 40 compared with nine of 10 in the treated group. Additional information is provided in Figure E2 (online). ** = P < .01, *** = P < .001.
Figure 5c:
Figure 5c:
Graphs show that MPO inhibition improves clinical symptoms and survival of mice with EAE. (a) Average clinical scores from 45 control saline-treated and 45 ABAH-treated mice with EAE demonstrate reduced disease exacerbation. (b) Significantly decreased maximum average clinical score was observed in the treated group during the first exacerbation and first relapse (10 saline-treated mice, 10 ABAH-treated mice) followed up to day 40. Error bars = standard error. (c) Maximum average clinical score in all 90 mice is also significantly decreased in the ABAH-treated group. Because some mice were analyzed before peak clinical disease, the average scores were slightly lower than shown in b. Error bars = standard error. (d) Of 20 mice followed up to day 40, only three of 10 control mice survived to day 40 compared with nine of 10 in the treated group. Additional information is provided in Figure E2 (online). ** = P < .01, *** = P < .001.
Figure 5d:
Figure 5d:
Graphs show that MPO inhibition improves clinical symptoms and survival of mice with EAE. (a) Average clinical scores from 45 control saline-treated and 45 ABAH-treated mice with EAE demonstrate reduced disease exacerbation. (b) Significantly decreased maximum average clinical score was observed in the treated group during the first exacerbation and first relapse (10 saline-treated mice, 10 ABAH-treated mice) followed up to day 40. Error bars = standard error. (c) Maximum average clinical score in all 90 mice is also significantly decreased in the ABAH-treated group. Because some mice were analyzed before peak clinical disease, the average scores were slightly lower than shown in b. Error bars = standard error. (d) Of 20 mice followed up to day 40, only three of 10 control mice survived to day 40 compared with nine of 10 in the treated group. Additional information is provided in Figure E2 (online). ** = P < .01, *** = P < .001.

References

    1. Gray E, Thomas TL, Betmouni S, Scolding N, Love S. Elevated myeloperoxidase activity in white matter in multiple sclerosis. Neurosci Lett 2008;444(2):195–198 - PubMed
    1. Gray E, Thomas TL, Betmouni S, Scolding N, Love S. Elevated activity and microglial expression of myeloperoxidase in demyelinated cerebral cortex in multiple sclerosis. Brain Pathol 2008;18(1):86–95 - PMC - PubMed
    1. Heppner FL, Greter M, Marino D, et al. Experimental autoimmune encephalomyelitis repressed by microglial paralysis. Nat Med 2005;11(2):146–152 - PubMed
    1. Bartnik BL, Juurlink BH, Devon RM. Macrophages: their myelinotrophic or neurotoxic actions depend upon tissue oxidative stress. Mult Scler 2000;6(1):37–42 - PubMed
    1. Jack C, Ruffini F, Bar-Or A, Antel JP. Microglia and multiple sclerosis. J Neurosci Res 2005;81(3):363–373 - PubMed

Publication types