. 2012;8(3):e1002570.
doi: 10.1371/journal.pgen.1002570. Epub 2012 Mar 15.

Genetic architecture of highly complex chemical resistance traits across four yeast strains

Affiliations

Genetic architecture of highly complex chemical resistance traits across four yeast strains

Ian M Ehrenreich et al. PLoS Genet. 2012.

Abstract

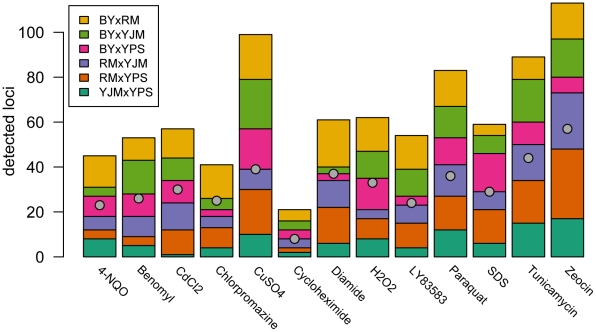
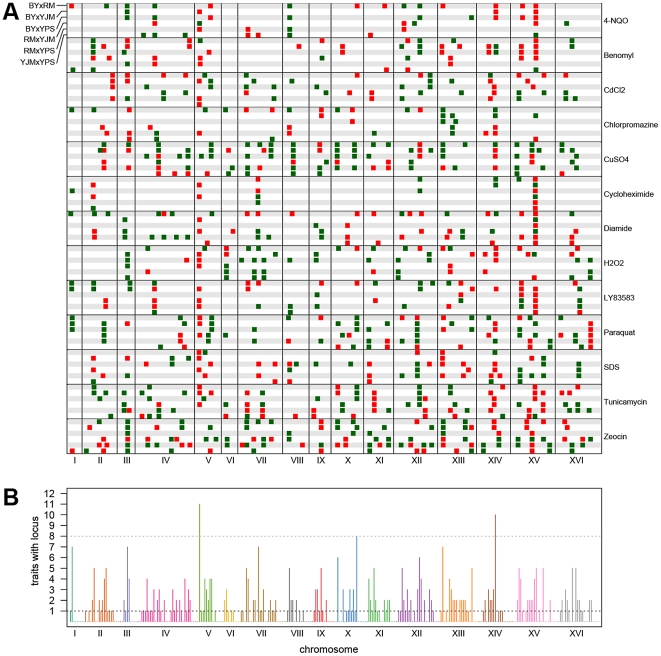
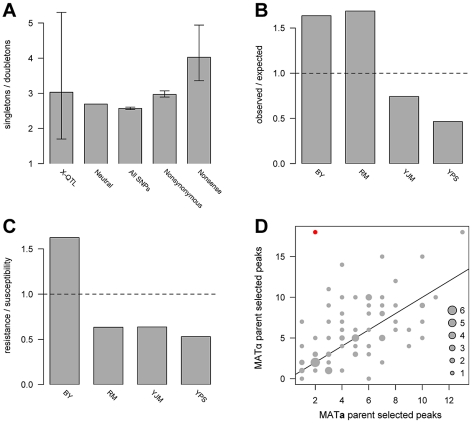
Many questions about the genetic basis of complex traits remain unanswered. This is in part due to the low statistical power of traditional genetic mapping studies. We used a statistically powerful approach, extreme QTL mapping (X-QTL), to identify the genetic basis of resistance to 13 chemicals in all 6 pairwise crosses of four ecologically and genetically diverse yeast strains, and we detected a total of more than 800 loci. We found that the number of loci detected in each experiment was primarily a function of the trait (explaining 46% of the variance) rather than the cross (11%), suggesting that the level of genetic complexity is a consistent property of a trait across different genetic backgrounds. Further, we observed that most loci had trait-specific effects, although a small number of loci with effects in many conditions were identified. We used the patterns of resistance and susceptibility alleles in the four parent strains to make inferences about the allele frequency spectrum of functional variants. We also observed evidence of more complex allelic series at a number of loci, as well as strain-specific signatures of selection. These results improve our understanding of complex traits in yeast and have implications for study design in other organisms.


Conflict of interest statement

The authors have declared that no competing interests exist.

Figures

Figure 1
Figure 1. Numbers of detected peaks and distinct loci.
The stacked bar plots show the number of peaks detected for each trait using X-QTL selections in each cross. The first parent listed in each cross was MATα and the second parent was MATa. The grey dots indicate the number of distinct loci detected in a condition after peak grouping.
Figure 2
Figure 2. Genome-wide plots of detected loci.
(A) Loci detected for each cross and trait, with green indicating loci selected in the direction of the MATα parent and red indicating loci selected in the direction of the MATa parent. For each trait, the crosses are vertically ordered as follows: BYxRM, BYxYJM, BYxYPS, RMxYJM, RMxYPS, YJMxYPS. (B) The number of traits affected by loci within each 50-kb window. The grey dotted line shows the threshold for significance, while the black dotted line highlights the bins in which only one trait was affected.
Figure 3
Figure 3. Population genetics of identified loci.
(A) shows the ratios of singletons to doubletons observed in the X-QTL data and for different classes of sequence variation, (B) plots the ratio of observed X-QTL singletons to expected singletons by strain, (C) plots the ratio of resistance-conferring singletons to susceptibility-conferring singletons by strain, and (D) plots the directionalities of peaks detected in the 78 X-QTL selections. In A, the error bars denote 95% confidence intervals. For the maximum likelihood estimate of the ratio of singletons to doubletons among X-QTL loci, the confidence interval was determined from the likelihood surface. For classes of sites analyzed in the resequencing data, confidence intervals were obtained using bootstrapping. The neutral estimate (8/3) is derived from a folded allele frequency spectrum for n = 4. The other three measurements were obtained directly from a multiple sequence alignment of the genome sequences of the four strains. In B, the number of expected allelic singletons per strain was determined by multiplying the total number of allelic singletons detected by the proportion of all SNP allelic singletons among the four strains present in that parental genome. The values in C were obtained from Table 1. The horizontal lines in B and C indicate a ratio of one. In D, the number of peaks selected in each direction in each X-QTL selection is plotted. One experiment—copper sulfate in the BYxRM cross—was significant for the sign test after a Bonferroni correction for multiple testing, indicating putative directional selection, and is shown in red. The number of experiments observed with a given number of up and down peaks is indicated by the size of a circle, with a key provided in the bottom right corner. The diagonal line in D shows a 1∶1 ratio of peaks selected in the direction of each parent.

References

    1. Falconer DS, Mackay TF. Introduction to quantitative genetics (4th edition) Harlow, England: Pearson Education Limited; 1996.
    1. Manolio TA, Collins FS, Cox NJ, Goldstein DB, Hindorff LA, et al. Finding the missing heritability of complex diseases. Nature. 2009;461:747–753. - PMC - PubMed
    1. Mackay TF, Stone EA, Ayroles JF. The genetics of quantitative traits: challenges and prospects. Nat Rev Genet. 2009;10:565–577. - PubMed
    1. Brem RB, Kruglyak L. The landscape of genetic complexity across 5,700 gene expression traits in yeast. Proc Natl Acad Sci U S A. 2005;102:1572–1577. - PMC - PubMed
    1. Ehrenreich IM, Torabi N, Jia Y, Kent J, Martis S, et al. Dissection of genetically complex traits with extremely large pools of yeast segregants. Nature. 2010;464:1039–1042. - PMC - PubMed

Publication types