. 2012;8(3):e1002575.
doi: 10.1371/journal.pgen.1002575. Epub 2012 Mar 15.

Temporal transcriptional profiling of somatic and germ cells reveals biased lineage priming of sexual fate in the fetal mouse gonad

Affiliations

Temporal transcriptional profiling of somatic and germ cells reveals biased lineage priming of sexual fate in the fetal mouse gonad

Samantha A Jameson et al. PLoS Genet. 2012.

Abstract

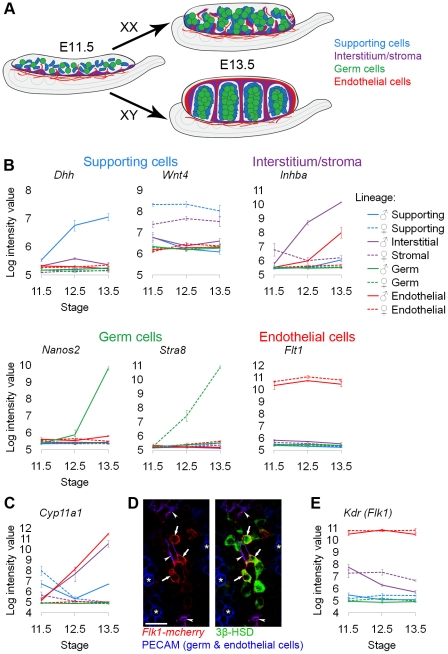
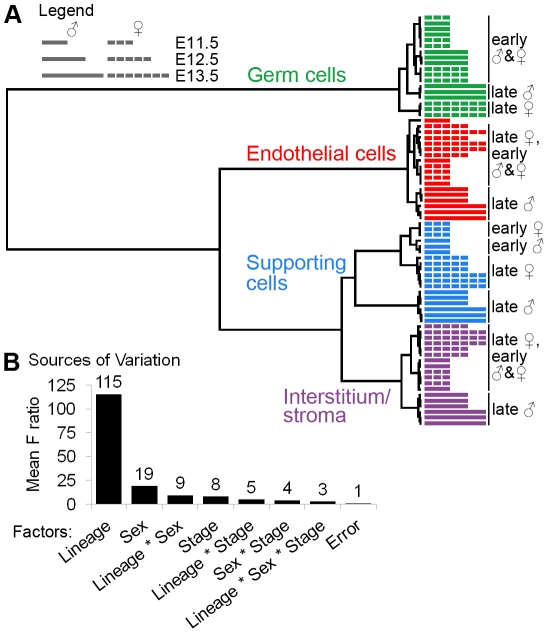
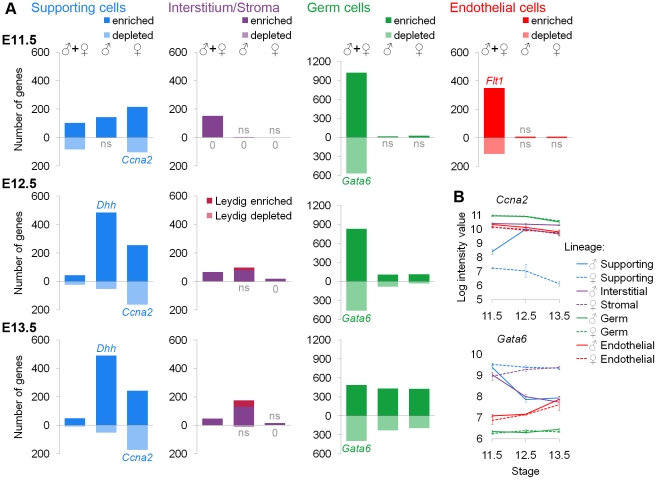
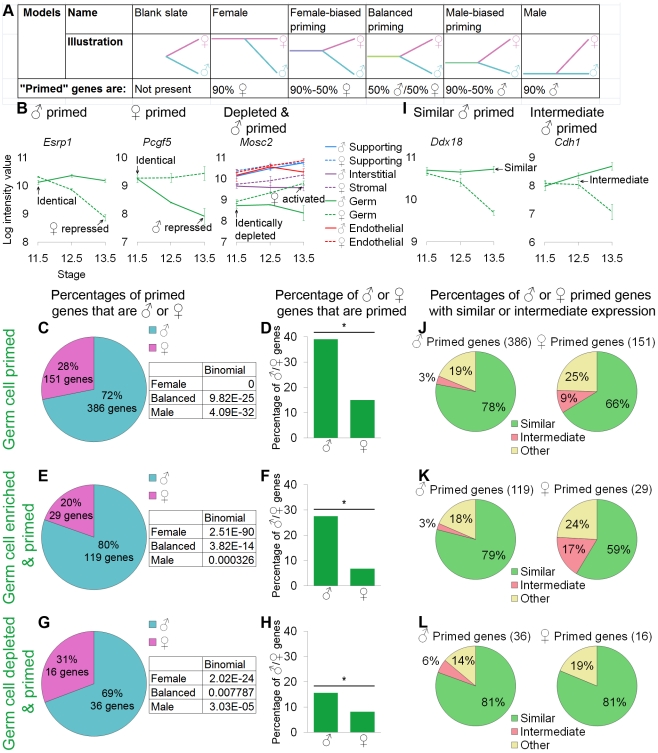
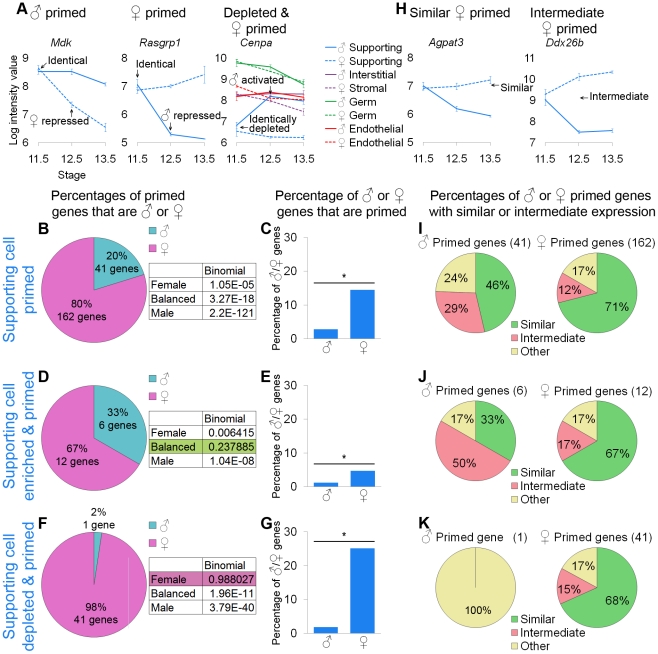
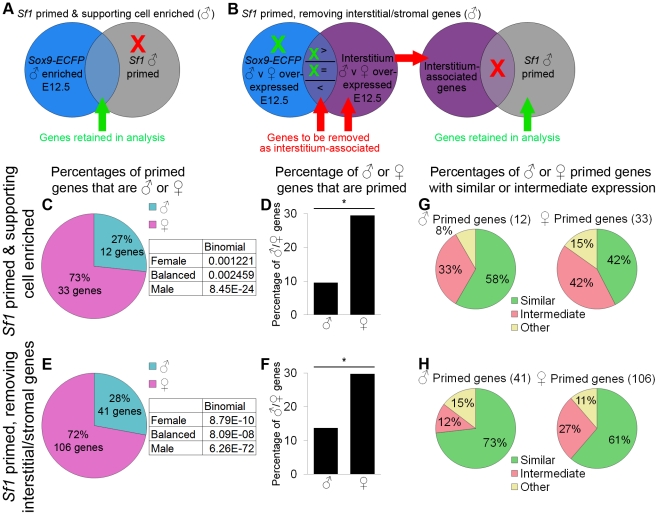
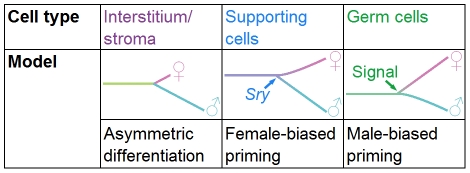
The divergence of distinct cell populations from multipotent progenitors is poorly understood, particularly in vivo. The gonad is an ideal place to study this process, because it originates as a bipotential primordium where multiple distinct lineages acquire sex-specific fates as the organ differentiates as a testis or an ovary. To gain a more detailed understanding of the process of gonadal differentiation at the level of the individual cell populations, we conducted microarrays on sorted cells from XX and XY mouse gonads at three time points spanning the period when the gonadal cells transition from sexually undifferentiated progenitors to their respective sex-specific fates. We analyzed supporting cells, interstitial/stromal cells, germ cells, and endothelial cells. This work identified genes specifically depleted and enriched in each lineage as it underwent sex-specific differentiation. We determined that the sexually undifferentiated germ cell and supporting cell progenitors showed lineage priming. We found that germ cell progenitors were primed with a bias toward the male fate. In contrast, supporting cells were primed with a female bias, indicative of the robust repression program involved in the commitment to XY supporting cell fate. This study provides a molecular explanation reconciling the female default and balanced models of sex determination and represents a rich resource for the field. More importantly, it yields new insights into the mechanisms by which different cell types in a single organ adopt their respective fates.


Conflict of interest statement

The authors have declared that no competing interests exist.

Figures

Figure 1
Figure 1. Sorted cell lineages and microarray validation.
(A) Illustration of the developing XX and XY gonad with supporting cells (blue), interstitial/stromal cells (purple), germ cells (green), and endothelial cells (red). (B, C, and F) Graphs of the log-transformed, normalized intensity values from the microarrays for control genes known to be specific to each lineage. The color for each lineage is conserved in all figures and matches the illustration (A), with XX (♀) values shown as dashed lines, and XY (♂) values shown as solid lines. The error bars are standard error of the mean (“standard error”) of the log transformed values. The Y-axis scale differs for each graph because each transcript cluster has its own intensity range. (B) The control genes were found in the expected lineage, except for (C) genes characteristic of Leydig cells. Leydig cell genes were highly expressed in both the interstitium (as expected) and the endothelial cell fraction. (D) Immunofluorescence of E13.5 XY gonads with Flk1-mCherry (red), PECAM1 (germ and endothelial cells, blue), and 3β-HSD (Leydig cells, green). Arrowheads indicate Flk1-mCherry and PECAM1 double positive endothelial cells. Arrows indicate Flk1-mCherry positive, PECAM1 negative cells that were positive for 3β-HSD, confirming aberrant reporter expression in some Leydig cells. Asterisks indicate germ cells positive for PECAM1 alone. Scale bar = 25 µm. (E) The XY interstitial cells have very low expression of the endogenous Flk1 (Kdr) transcript at E13.5, supporting our conclusion that the Flk1-mCherry transgene is aberrantly expressed in Leydig cells.
Figure 2
Figure 2. Gene expression was affected by lineage, sex, and stage.
(A) Clustering dendrogram of individual microarray samples. The E11.5, E12.5, and E13.5 samples are represented by short, intermediate, and long bars, respectively. The dashed bars indicate XX samples, and the solid bars indicate XY samples. Ward's method with squared Euclidean distance as the distance metric was used. The arrays cluster primarily by lineage, and secondarily by sex and stage. (B) Analysis of the sources of variation confirmed that the primary source of variation is lineage, and secondarily sex and stage.
Figure 3
Figure 3. Lineage-specific enriched and depleted genes revealed distinct differentiation programs.
(A) Graphs of the number of genes specific to each lineage. The gene lists and permutation tests are provided in Dataset S2. The “♂” and “♀” symbols indicate lineage-specific and sex-specific genes, while the “♂+♀” symbol indicates genes that are lineage-specific and sex-independent. Pale bars below the axis indicate genes that are depleted relative to other lineages. The E11.5 graphs are on the top row, the E12.5 graphs are in the middle, and the E13.5 graphs are on the bottom row. The germ cell Y-axis is scaled to accommodate the larger number of genes specific to this lineage. Leydig cell genes (burgundy) were separately identified by cross-referencing the endothelial and interstitial data and added to the bars for the XY interstitium. Lists with >20% false positives are indicated by “ns”. Lists with no genes are marked with “0”. Some bars also have a colored gene name exemplifying the pattern within that category (the graphs for Dhh and Flt1 appear in Figure 1B). (B) Graphs of the log-transformed, normalized intensity values for genes that are sex-specifically (Ccna2) and sex-independently (Gata6) depleted. The error bars are standard error. Three lineages showed specific gene depletion in addition to enrichment. Each lineage had transcriptionally distinct progenitors as indicated by “♂+♀” genes at E11.5. Supporting cells were already in the midst of their sex-specific differentiation by E11.5 as indicated by genes in the “♂” or “♀” columns at E11.5, but the other cell types were sexually undifferentiated at E11.5.
Figure 4
Figure 4. Germ cells showed lineage priming with a male bias.
(A) Models tested and their predictions for the relationship between the differentiated cells and their undifferentiated progenitors. (B, I) Graphs of the log-transformed, normalized intensity values. The error bars are standard error. Only the values for germ cells are shown, except in the depleted and primed example where all lineages are shown for comparison (B). (B) Esrp1 and Pcgf5 are examples of male- and female-primed genes, and Mosc2 is an example of a male-primed depleted gene. We used three different methods to identify primed genes: (C, D, and J) all primed genes were considered, (E, F, and K) only primed and lineage-specifically enriched genes were considered, and (G, H, and L) lineage-specifically depleted primed genes were analyzed. (C, E, and G) The percentages of primed genes that were male-primed and female-primed: all methods showed male-biased priming. The boxes contain the p-values from the binomial test with the expected percentages of the extreme models: 90% male genes (“Male”), 50% male and female genes (“Balanced”), and 90% female genes (“Female”) (see A). All of the extreme models were excluded because p-values were <0.05. (D, F, and H) The percentages of male or female genes that were primed. Significance (*) was determined with the hypergeometric test (p-value<0.05). (I) Graphs illustrating two primed genes whose expression in progenitors is “similar” to the differentiated cell in one sex or “intermediate” between the two sexes. (J–L) In all cases, for both sexes, the majority of primed genes were similarly expressed in germ cell progenitors and differentiated cells of one sex. Gene lists and permutation tests are provided in Dataset S4.
Figure 5
Figure 5. Supporting cells showed lineage priming with a female bias.
(A and H) Graphs of the log-transformed, normalized intensity values of genes. The error bars are standard error. Only the values for supporting cells are shown, except in the depleted and primed example where all cell types are shown. (A) Mdk and Rasgrp1 are examples of male- and female-primed genes and Cenpa is an example of a female-primed depleted gene. As in the germ cell analysis, we examined all primed genes (B, C, and I), primed and lineage-specifically enriched genes (D, E, and J), and primed and lineage-specifically depleted genes (F, G, and K). (B, D, and F) The percentages of primed genes that were male-primed and female-primed. The boxes contain the p-values from the binomial test with the expected percentages of the extreme models. (B) Using the first method, all of the extreme models could be excluded because they had a p-value<0.05. (D and F) However, using the second and third methods, the balanced and female models could not be excluded, respectively. (C, E, and G) Nevertheless, examining the percentage of male or female genes that were primed, all methods showed a significant (*) bias toward the female pathway, as determined by the hypergeometric test (p-value<0.05). Taken together, the data supported female-biased priming. (H) Graphs illustrating two primed genes, whose expression in the progenitor is “similar” to the differentiated cell of one sex, or “intermediate” between the two sexes. (I–K) The female-primed genes were predominantly similarly expressed, but the male-primed genes showed more variability. Gene lists and permutation tests are provided in Dataset S4.
Figure 6
Figure 6. Data from sorted Sf1-EGFP cells also supported female-biased priming for supporting cells.
(A–B) Graphical illustrations of the genes included in our analysis of priming in the Sf1-EGFP data. Because the Sf1-positive population is a mixture of lineages, we used two methods to identify the primed genes associated with supporting cells. XY cells are illustrated in this example, but the same operations were also performed for XX cells. (A) “Sf1 primed and supporting cell enriched” genes were both male-primed in the Sf1-EGFP data (comparing E11.0 and E12.5) and lineage-specifically enriched in our XY Sry-EGFP/Sox9-ECFP purified supporting cells at E12.5. Red indicates genes being removed from the analysis, and green indicates genes being retained. (B) For the “Sf1 primed, removing interstitial/stromal genes”, we removed genes associated with the interstitial/stromal cells at E12.5 (i.e., sexually dimorphic in the interstitium/stroma) from the Sf1-EGFP primed genes. Genes that were expressed sexually dimorphically in both the interstitial/stromal cells and the supporting cells were removed only if expression was higher in the interstitial/stromal cells than in the Sry-EGFP/Sox9-ECFP supporting cells. The Sf1-EGFP primed genes that were enriched in the Sry-EGFP/Sox9-ECFP supporting cells (C, D, and G) and those that were identified by removing interstitial/stromal genes (E, F, and H) were analyzed separately. (C and E) The percentages of primed genes that were male-primed and female-primed. Both methods showed a female bias. The boxes contain the p-values from the binomial test with the expected percentages of the extreme models, and all extreme models could be rejected as having a p-value<0.05. (D and F) The percentage of male or female genes that were primed showed a significant (*) bias toward the female pathway, as determined by the hypergeometric test (p-value<0.05). (G and H) However, primed genes in both sexes were predominantly expressed at similar levels in progenitors and E12.5 supporting cells of one sex. While supporting cell progenitors have a female bias, they also express some markers of the male pathway at levels similar to male supporting cells at E12.5. Gene lists and permutation tests are provided in Dataset S5.
Figure 7
Figure 7. Models of differentiation for the different gonadal lineages.
The interstitial/stromal cells differentiate asymmetrically over the time period examined, as we detected few genes specific to the XX stroma by E13.5, whereas, the XY interstitial population acquired a larger set of lineage-specific genes. Supporting cells are primed with a female bias. The natural progression of the primed state may be to adopt the female differentiated state, but in the presence of Sry the cells repress the female program and adopt the male fate. Conversely, germ cells are primed with a male bias. An extrinsic signal may be required from the mesonephros to induce the adoption of the female fate; otherwise, germ cells adopt the male fate.

References

    1. Koopman P, Gubbay J, Vivian N, Goodfellow P, Lovell-Badge R. Male development of chromosomally female mice transgenic for Sry. Nature. 1991;351:117–121. - PubMed
    1. Gubbay J, Collignon J, Koopman P, Capel B, Economou A, et al. A gene mapping to the sex-determining region of the mouse Y chromosome is a member of a novel family of embryonically expressed genes. Nature. 1990;346:245–250. - PubMed
    1. Karl J, Capel B. Sertoli cells of the mouse testis originate from the coelomic epithelium. Dev Biol. 1998;203:323–333. - PubMed
    1. Wylie C. Germ cells. Cell. 1999;96:165–174. - PubMed
    1. Coveney D, Cool J, Oliver T, Capel B. Four-dimensional analysis of vascularization during primary development of an organ, the gonad. Proc Natl Acad Sci U S A. 2008;105:7212–7217. - PMC - PubMed

Publication types