. 2012;7(3):e31253.
doi: 10.1371/journal.pone.0031253. Epub 2012 Mar 9.

Amyloid-like fibril formation by polyQ proteins: a critical balance between the polyQ length and the constraints imposed by the host protein

Affiliations

Amyloid-like fibril formation by polyQ proteins: a critical balance between the polyQ length and the constraints imposed by the host protein

Natacha Scarafone et al. PLoS One. 2012.

Abstract

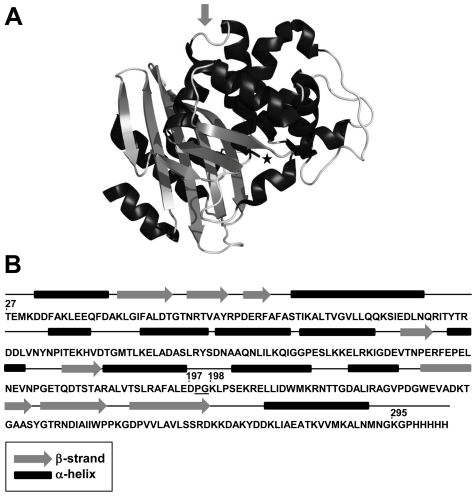
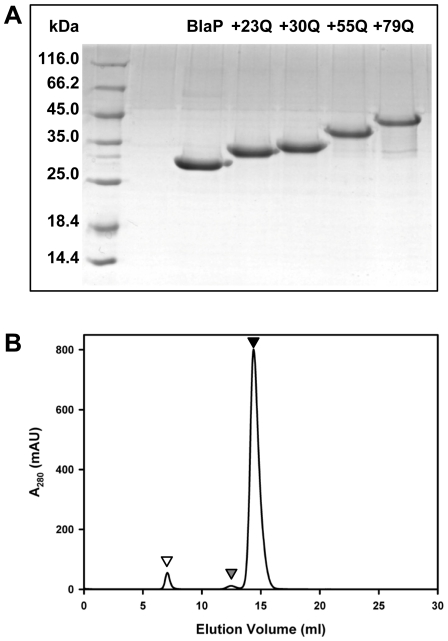
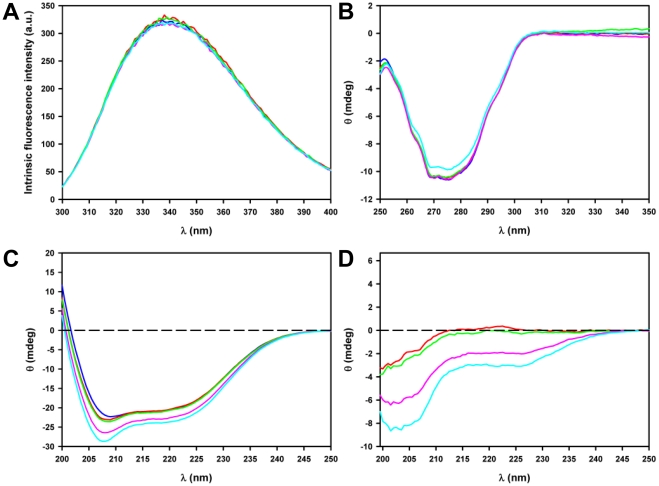
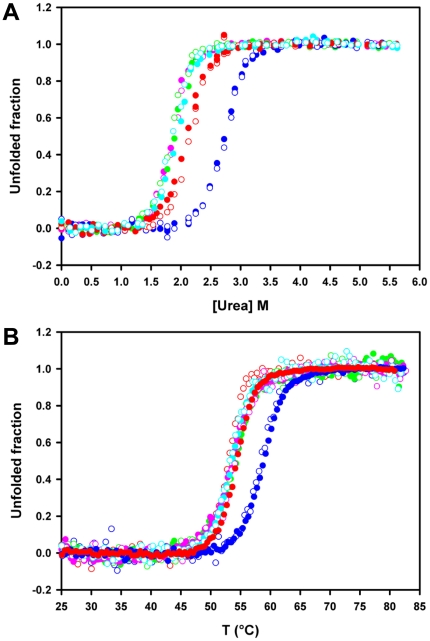
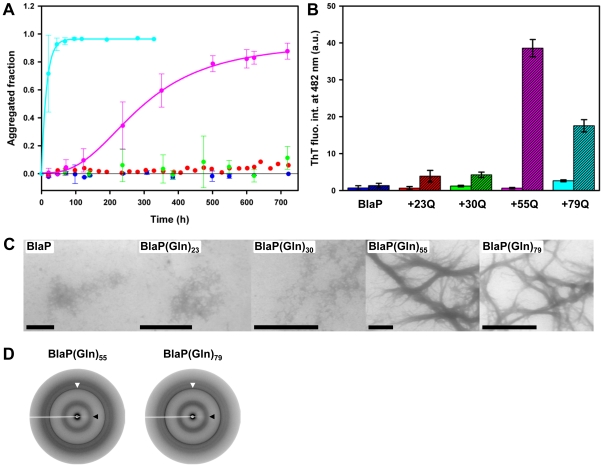
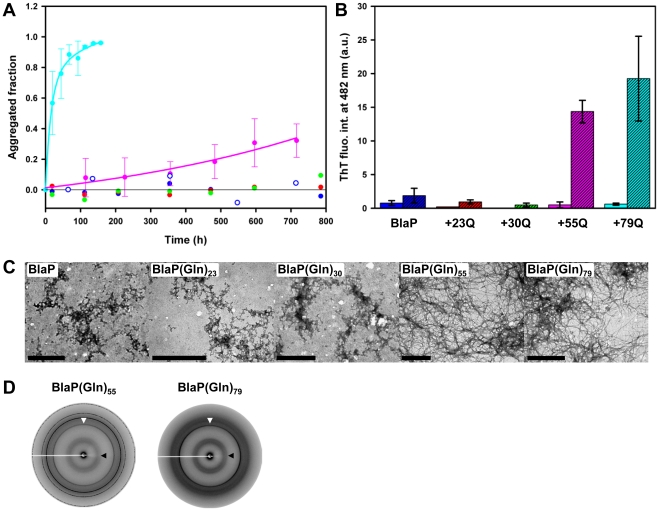
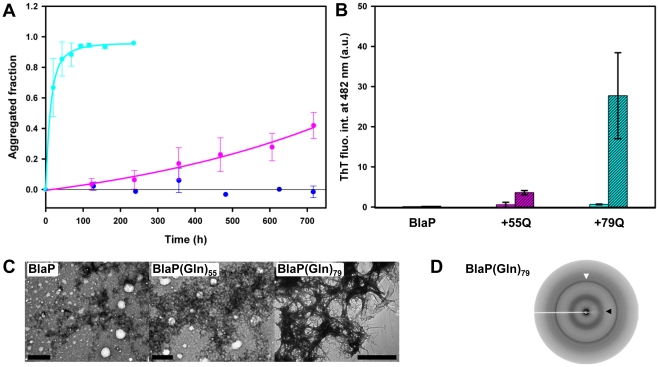
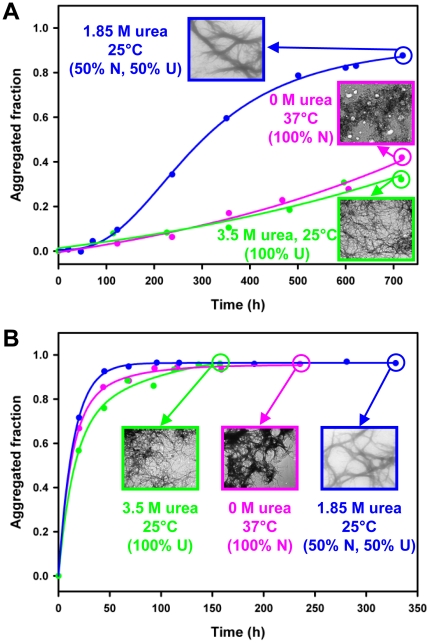
Nine neurodegenerative disorders, called polyglutamine (polyQ) diseases, are characterized by the formation of intranuclear amyloid-like aggregates by nine proteins containing a polyQ tract above a threshold length. These insoluble aggregates and/or some of their soluble precursors are thought to play a role in the pathogenesis. The mechanism by which polyQ expansions trigger the aggregation of the relevant proteins remains, however, unclear. In this work, polyQ tracts of different lengths were inserted into a solvent-exposed loop of the β-lactamase BlaP and the effects of these insertions on the properties of BlaP were investigated by a range of biophysical techniques. The insertion of up to 79 glutamines does not modify the structure of BlaP; it does, however, significantly destabilize the enzyme. The extent of destabilization is largely independent of the polyQ length, allowing us to study independently the effects intrinsic to the polyQ length and those related to the structural integrity of BlaP on the aggregating properties of the chimeras. Only chimeras with 55Q and 79Q readily form amyloid-like fibrils; therefore, similarly to the proteins associated with diseases, there is a threshold number of glutamines above which the chimeras aggregate into amyloid-like fibrils. Most importantly, the chimera containing 79Q forms amyloid-like fibrils at the same rate whether BlaP is folded or not, whereas the 55Q chimera aggregates into amyloid-like fibrils only if BlaP is unfolded. The threshold value for amyloid-like fibril formation depends, therefore, on the structural integrity of the β-lactamase moiety and thus on the steric and/or conformational constraints applied to the polyQ tract. These constraints have, however, no significant effect on the propensity of the 79Q tract to trigger fibril formation. These results suggest that the influence of the protein context on the aggregating properties of polyQ disease-associated proteins could be negligible when the latter contain particularly long polyQ tracts.


Conflict of interest statement

Competing Interests: The authors have read the journal's policy and have the following conflicts: Current address of GG, NY and PF: ProGenosis S.A., Boulevard du Rectorat, 27b, Sart-Tilman, 4000 Liège, Belgium. These three persons are employed by the company. This does not alter the authors' adherence to all the PLoS ONE policies on sharing data and materials.

Figures

Figure 1
Figure 1. X-ray structure and topology of the host protein BlaP.
(A) The structure of BlaP was produced using PyMOL (DeLano Scientific LLC, South San Francisco, CA, USA) and the PDB ID is 4BLM [42]. The active site serine (Ser70) is indicated by a star and the insertion site is shown by an arrow. (B) Topology of BlaP. The position 197–198 of the insertion site refers to the numbering scheme of class A β-lactamases [65]. The underlined PG dipeptide between residues 197 and 198 corresponds to the SmaI restriction site inserted into the gene of BlaP for the cloning of CAG repeats.
Figure 2
Figure 2. Purification of BlaP and the chimeras.
(A) Purified BlaP and polyQ-containing chimeras separated on a 15% (w/v) SDS-polyacrylamide gel and stained with coomassie blue. First lane on the left shows protein markers with molecular masses as indicated, whereas the other lanes show BlaP and the various chimeric proteins as indicated. Expected molecular masses are 30 368, 33 315, 34 212, 37 416 and 40 491 Da for BlaP and chimeras with 23, 30, 55 and 79 glutamines, respectively. (B) SEC analysis of BlaP(Gln)79 at 120 µM in PBS, pH 7.5; mAU, milli-absorbance units. Monomeric, dimeric and high molecular weight species are indicated by black, grey and white arrows, respectively. The high molecular weight oligomeric species are eluted in the void volume of the column.
Figure 3
Figure 3. PolyQ insertions have no effect on the structure of BlaP.
(A) Intrinsic fluorescence, (B) near-UV CD and (C) far-UV CD spectra of BlaP (blue) and the chimeras with 23 (red), 30 (green), 55 (pink) and 79 (cyan) glutamines. a.u., arbitrary units. (D) Difference spectra obtained by subtraction of the far-UV CD spectrum of BlaP from that of each chimeric protein. Spectra were recorded at 25°C in PBS, pH 7.5, using protein concentrations of 4.6 µM (fluorescence and far-UV CD) and 20 µM (near-UV CD).
Figure 4
Figure 4. PolyQ insertions destabilize BlaP and the extent of destabilization is largely independent of the polyQ length.
(A) Normalized urea-induced unfolding transitions at pH 7.5 and 25°C and (B) normalized heat-induced unfolding transitions at pH 7.5, monitored by the changes in fluorescence intensity at 323 nm (filled circles) and in ellipticty at 222 nm (open circles), using a protein concentration of 4.6 µM. BlaP (blue), BlaP(Gln)23 (red), BlaP(Gln)30 (green), BlaP(Gln)55 (pink) and BlaP(Gln)79 (cyan). Non-normalized data were analysed on the basis of a two-state model and the values of the thermodynamic parameters obtained are reported in Table 3.
Figure 5
Figure 5. Only BlaP(Gln)55 and BlaP(Gln)79 form amyloid-like fibrils when incubated in the presence of 1.85 M urea.
(A) Aggregation kinetics of 110 µM BlaP (blue), BlaP(Gln)23 (red), BlaP(Gln)30 (green), BlaP(Gln)55 (pink) and BlaP(Gln)79 (cyan) at 25°C in the presence of 1.85 M urea in PBS, pH 7.5, followed by measuring the concentration of protein remaining soluble. Time-points shown with an error bar are the average of three independent time-courses for BlaP(Gln)30, BlaP(Gln)55 and BlaP(Gln)79 and two independent time-courses for BlaP. Error bars show the standard deviations. Only one time-course was carried out with BlaP(Gln)23. (B) ThT fluorescence intensities at 482 nm in the presence of BlaP and chimeras samples at T0 (solid bars) and Tf (dashed bars). T0 and Tf correspond to the initial and final points of one time-course for each protein. Data are the average of three measurements and error bars represent the standard deviations. a.u., arbitrary units. (C) TEM images of the protein samples at Tf. The scale bar is 1 µm. (D) X-ray fibre diffraction patterns from BlaP(Gln)55 and BlaP(Gln)79 fibrils. White and black arrows indicate meridional and equatorial reflections at 4.7 Å and ca. 9.5 Å, respectively.
Figure 6
Figure 6. The unfolding of the β-lactamase moiety is not the critical factor that triggers the aggregation process.
(A) Aggregation kinetics of 110 µM BlaP (blue), BlaP(Gln)23 (red), BlaP(Gln)30 (green), BlaP(Gln)55 (pink) and BlaP(Gln)79 (cyan) at 25°C in the presence of 3.5 M urea in PBS, pH 7.5, followed by measuring the concentration of protein remaining soluble. Time-points shown with an error bar are the average of three independent time-courses for BlaP(Gln)55 and BlaP(Gln)79. Error bars show the standard deviations. For BlaP, two independent experiments were carried out (filled and open blue circles); however, since the times at which samples were taken differ from one time-course to the other, the data could not be averaged. For BlaP(Gln)23 and BlaP(Gln)30, only one time-course was carried out. (B) ThT fluorescence intensities at 482 nm in the presence of BlaP and chimeras samples at T0 (solid bars) and Tf (dashed bars). T0 and Tf correspond to the initial and final points of one time-course for each protein. Data are the average of three measurements and error bars represent the standard deviations. a.u., arbitrary units. (C) TEM images of the protein samples at Tf. The scale bar is 1 µm. (D) X-ray fibre diffraction patterns from BlaP(Gln)55 and BlaP(Gln)79 fibrils. White and black arrows indicate meridional and equatorial reflections at 4.7 Å and ca. 9.5 Å, respectively.
Figure 7
Figure 7. Only BlaP(Gln)79 form amyloid-like fibrils when incubated under native conditions.
(A) Aggregation kinetics of 110 µM BlaP (blue), BlaP(Gln)55 (pink) and BlaP(Gln)79 (cyan) at 37°C in PBS, pH 7.5, followed by measuring the concentration of protein remaining soluble. Time-points shown with an error bar are the average of three independent time-courses for BlaP(Gln)55 and BlaP(Gln)79 and two independent time-courses for BlaP. Error bars show the standard deviations. (B) ThT fluorescence intensities at 482 nm in the presence of BlaP and chimeras samples at T0 (solid bars) and Tf (dashed bars). T0 and Tf correspond to the initial and final points of one time-course for each protein. Data are the average of three measurements and error bars represent the standard deviations. ThT fluorescence intensities in the presence of BlaP samples are weak and for more visibility, error bars (which are equal or less than to 0.3) are not shown. a.u., arbitrary units. (C) TEM images of the protein samples at Tf. The scale bar is 1 µm. (D) X-ray fibre diffraction pattern from BlaP(Gln)79 fibrils at Tf. White and black arrows indicate meridional and equatorial reflections at 4.7 Å and ca. 9.5 Å, respectively.
Figure 8
Figure 8. The ability of BlaP(Gln)79 to form amyloid-like fibrils does not depend on the structural integrity of BlaP.
Comparison between the aggregation kinetics and the morphology of aggregates obtained with BlaP(Gln)55 (A) and BlaP(Gln)79 (B) under the following conditions of incubation: (i) PBS, pH 7.5 and 0 M urea at 37°C (pink), (ii) PBS, pH 7.5 and 1.85 M urea at 25°C (blue) and (iii) PBS, pH 7.5 and 3.5 M urea at 25°C (green). N is the native state and U is the unfolded state. The data correspond to those shown in Figures 5, 6, 7 without error bars.

Similar articles

Cited by

References

    1. Orr HT, Zoghbi HY. Trinucleotide repeat disorders. Annu Rev Neurosci. 2007;30:575–621. - PubMed
    1. Ordway JM, Tallaksen-Greene S, Gutekunst CA, Bernstein EM, Cearley JA, et al. Ectopically expressed CAG repeats cause intranuclear inclusions and a progressive late onset neurological phenotype in the mouse. Cell. 1997;91:753–763. - PubMed
    1. Robitaille Y, Lopes-Cendes I, Becher M, Rouleau G, Clark AW. The neuropathology of CAG repeat diseases: review and update of genetic and molecular features. Brain Pathol. 1997;7:901–926. - PMC - PubMed
    1. Zoghbi HY, Orr HT. Glutamine repeats and neurodegeneration. Annu Rev Neurosci. 2000;23:217–247. - PubMed
    1. Robertson AL, Bottomley SP. Towards the treatment of polyglutamine diseases: the modulatory role of protein context. Curr Med Chem. 2010;17:3058–3068. - PubMed

Publication types

MeSH terms