. 2012 Mar 22:13:110.
doi: 10.1186/1471-2164-13-110.

Evolution of the metabolic and regulatory networks associated with oxygen availability in two phytopathogenic enterobacteria

Affiliations

Evolution of the metabolic and regulatory networks associated with oxygen availability in two phytopathogenic enterobacteria

Lavanya Babujee et al. BMC Genomics. .

Abstract

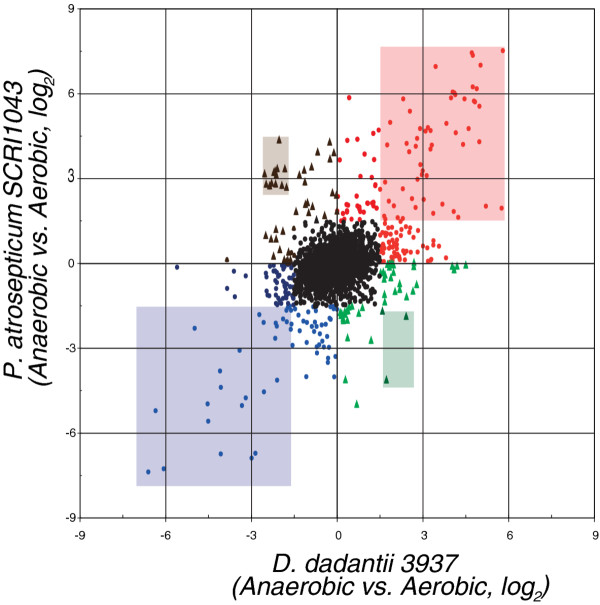
Background: Dickeya dadantii and Pectobacterium atrosepticum are phytopathogenic enterobacteria capable of facultative anaerobic growth in a wide range of O2 concentrations found in plant and natural environments. The transcriptional response to O2 remains under-explored for these and other phytopathogenic enterobacteria although it has been well characterized for animal-associated genera including Escherichia coli and Salmonella enterica. Knowledge of the extent of conservation of the transcriptional response across orthologous genes in more distantly related species is useful to identify rates and patterns of regulon evolution. Evolutionary events such as loss and acquisition of genes by lateral transfer events along each evolutionary branch results in lineage-specific genes, some of which may have been subsequently incorporated into the O2-responsive stimulon. Here we present a comparison of transcriptional profiles measured using densely tiled oligonucleotide arrays for two phytopathogens, Dickeya dadantii 3937 and Pectobacterium atrosepticum SCRI1043, grown to mid-log phase in MOPS minimal medium (0.1% glucose) with and without O2.

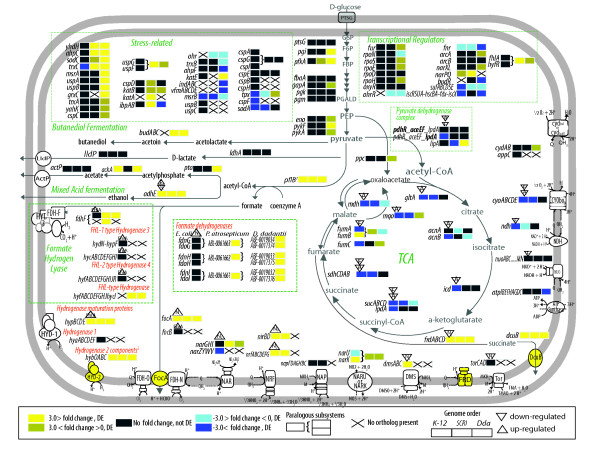
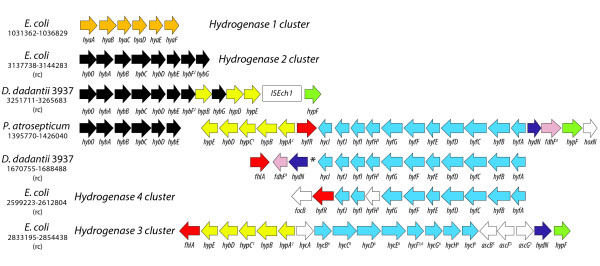
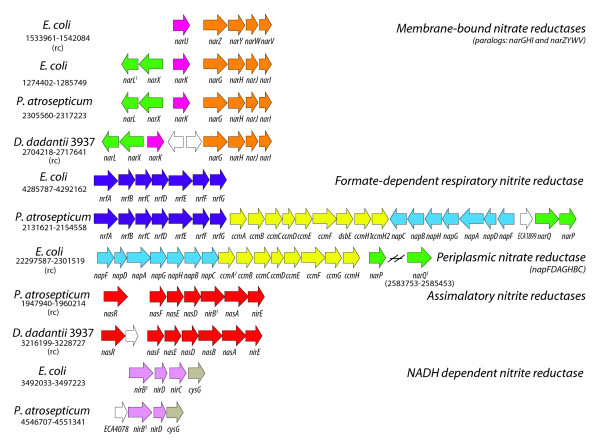
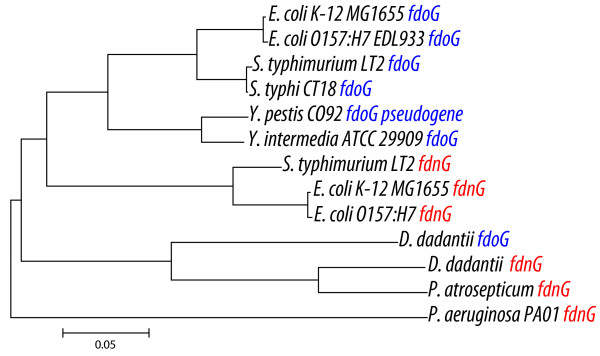
Results: More than 7% of the genes of each phytopathogen are differentially expressed with greater than 3-fold changes under anaerobic conditions. In addition to anaerobic metabolism genes, the O2 responsive stimulon includes a variety of virulence and pathogenicity-genes. Few of these genes overlap with orthologous genes in the anaerobic stimulon of E. coli. We define these as the conserved core, in which the transcriptional pattern as well as genetic architecture are well preserved. This conserved core includes previously described anaerobic metabolic pathways such as fermentation. Other components of the anaerobic stimulon show variation in genetic content, genome architecture and regulation. Notably formate metabolism, nitrate/nitrite metabolism, and fermentative butanediol production, differ between E. coli and the phytopathogens. Surprisingly, the overlap of the anaerobic stimulon between the phytopathogens is also relatively small considering that they are closely related, occupy similar niches and employ similar strategies to cause disease. There are cases of interesting divergences in the pattern of transcription of genes between Dickeya and Pectobacterium for virulence-associated subsystems including the type VI secretion system (T6SS), suggesting that fine-tuning of the stimulon impacts interaction with plants or competing microbes.

Conclusions: The small number of genes (an even smaller number if we consider operons) comprising the conserved core transcriptional response to O2 limitation demonstrates the extent of regulatory divergence prevalent in the Enterobacteriaceae. Our orthology-driven comparative transcriptomics approach indicates that the adaptive response in the eneterobacteria is a result of interaction of core (regulators) and lineage-specific (structural and regulatory) genes. Our subsystems based approach reveals that similar phenotypic outcomes are sometimes achieved by each organism using different genes and regulatory strategies.


Figures

Figure 1
Figure 1
Scatterplot of fold changes for the 2889 orthologous genes in D. dadantii vs P. atrosepticum. Fold change values are represented as log ratio of expression in anaerobic vs. aerobic condition. The categories represented are: Statistically significant up-regulation with fold changes greater than 3 (log2 > 1.5) in both organisms (orange box), Statistically significant down-regulation with fold changes greater than 3 (log2 > 1.5) in both organisms (purple box), Statistically significant expression in both organisms but in opposite directions (up-regulated in D. dadantii: green box, down-regulated in D. dadantii: brown box) and Equivalently expressed in both organisms (black). At least 81 genes are part of a highly differentially regulated core of genes conserved across D. dadantii and P. atrosepticum (orange and purple boxes) and this minimum core grows to 222 genes if we allow smaller, but statistically significant differences between aerobic and anaerobic samples (red and blue filled circles). We observe divergent expression patterns in which orthologs are up-regulated > 3- fold in one organism and down-regulated > 3- fold (log2 > 1.5) in the other organism for 15 ortholog sets (brown and green boxes), and at least 35 additional ortholog sets show a less extreme, but nevertheless divergent pattern (brown and green filled triangles). Genes that are differentially expressed in one organism only, have not been distinguished in the figure. Given the overall larger number of genes called differentially expressed for D. dadantii relative to P. atrosepticum, there are many cases where the ortholog in one organism is called differentially expressed (and with fold change > 3), while the ortholog in the other genome is not (966 ortholog groups in D. dadantii and 77 different groups in P. atrosepticum). In most cases both members of the ortholog group trend in the same direction (766 orthologs) rather than exhibiting divergent expression (277 orthologs).
Figure 2
Figure 2
Metabolic overview of conserved pathways in E. coli, P. atrosepticum and D. dadantii. Changes in gene expression under anaerobic conditions are shown for all three organisms and are represented by different colors. Fold change patterns and genome order are as follows: E. coli, P. atrosepticum and D. dadantii (see key within the figure). Each orthologous group of genes is represented by three blocks colored by fold change (dark blue: down-regulated, fold change > 3; light blue: down-regulated, fold change < 3; bright yellow: up-regulated, fold change > 3; dirty yellow: up-regulated, fold change < 3; black: no change in expression, X: ortholog absent in that organism). Fold change values for poly-cistronic operons are averaged across genes. The transcriptional regulators FNR, ArcA, NarP, NarL and FhlA, for which there are known targets, are denoted in the figure based on their mode of regulation: (▲) up regulated (▼) down-regulated. Several components in this figure, such as fermentation and respiratory chains are adapted from Unden and Dunnwald and Sawers et al. 2004 [34,46]. A more detailed diagram of the genomic structure for formate hydrogen lyase complex and accompanying hydrogenases (HYD 1-4) is shown in Figure 3.
Figure 3
Figure 3
Genomic architecture of hydrogenase gene clusters from E. coli, D. dadantii and P. atrosepticum. Gene order and orientation of hydrogenase gene clusters from all three organisms are illustrated, including 4 clusters from E. coli, 2 from D. dadantii 3937 and 1 from P. atrosepticum SCRI1043. Direction (forward or reverse complement indicated by (rc)) was selected to maximize collinearity with the single hydrogenase cluster from P. atrosepticum. Colors are indicative of OrthoMCL grouping unless otherwise indicated by footnotes such that each color marks the genes associated with E. coli clusters and members of orthologous groups from D. dadantii 3937 and P. atrosepticum SCRI1043 labeled with the same name. White genes are singletons with no orthologs in the other two organisms. 1. hypC has an ortholog in D. dadantii 3937 that is located elsewhere, 2. hybF and hypA are grouped by OrthoMCL, 3. hycF (E. coli) and hyfH (D. dadantii 3937 and P. atrosepticum SCRI1043) are grouped by OrthoMCL, but E. coli hyfH is not part of the cluster (singleton), 4. fdhF has an ortholog in E. coli that is located elsewhere, 5. ascBF and ascG have orthologs in P. atrosepticum SCRI1043 that are located elsewhere, 6. OrthoMCL groups most members of the E. coli hydrogenase 3 and 4 systems.
Figure 4
Figure 4
Genomic architecture of genes involved with nitrate/nitrite metabolism in E. coli, D. dadantii and P. atrosepticum. Direction (forward or reverse complement indicated by (rc)) was selected to maximize collinearity. Colors are indicative of OrthoMCL grouping unless otherwise indicated by footnotes such that each color marks the genes associated with E. coli clusters and members of orthologous groups from D. dadantii 3937 and P. atrosepticum SCRI1043 labeled with the same name. White genes are singletons with no orthologs in the other two organisms. 1. narPQ and narXL are paralogous components in E. coli and P. atrosepticum SCRI1043. The narQ locus is located elsewhere in the chromosome, 2. ccmABCDEFGH, type 1 cytochrome C biogenesis system contains a duplication of ccmH in P. atrosepticum, 3. OrthoMCL cluster that includes the nirB encoded large subunit from E. coli, a single protein from D. dadantii 3937 annotated as nirB, and two paralogs from P. atrosepticum SCRI1043, annotated as nirB and nasB.
Figure 5
Figure 5
Phylogenetic analysis of the major subunit of formate dehydrogenases from select enterobacteria. Sequences of the major subunit of formate dehydrogenase from Fdh-O and Fdh-N were aligned using CLUSTALW. The tree was constructed using NJ with default parameters of MEGA 4.0.

References

    1. Perombelon MCM. Potato diseases caused by soft rot erwinias: an overview of pathogenesis. Plant Pathol. 2002;51(1):1–12. 10.1046/j.0032-0862.2001.Short title.doc.x.
    1. Lemattre P. Chimie horticole, Nouvelle éd. edn. Paris,: J.-B. Baillière; 1972.
    1. Harrison MD, Nielsen LW. In: Compendium of Potato Diseases. Hooker WJ, St. Paul MN, editor. American Phytopathological Society; 1981. Blackleg and bacterial soft rot; pp. 27–29.
    1. Ma B, Hibbing ME, Kim HS, Reedy RM, Yedidia I, Breuer J, Glasner JD, Perna NT, Kelman A, Charkowski AO. Host range and molecular phylogenies of the soft rot enterobacterial genera Pectobacterium and Dickeya. Phytopathology. 2007;97(9):1150–1163. doi: 10.1094/PHYTO-97-9-1150. - DOI - PubMed
    1. Perombelon MCM, Kelman A. Ecology of the Soft Rot Erwinias. Annu Rev Phytopathol. 1980;18(1):361–387. doi: 10.1146/annurev.py.18.090180.002045. - DOI

Publication types

MeSH terms

Substances

LinkOut - more resources