. 2012 Mar 22:13:32.
doi: 10.1186/1471-2202-13-32.

Magnetic nanoparticles in primary neural cell cultures are mainly taken up by microglia

Affiliations

Magnetic nanoparticles in primary neural cell cultures are mainly taken up by microglia

Josephine Pinkernelle et al. BMC Neurosci. .

Abstract

Background: Magnetic nanoparticles (MNPs) offer a large range of applications in life sciences. Applications in neurosciences are one focus of interest. Unfortunately, not all groups have access to nanoparticles or the possibility to develop and produce them for their applications. Hence, they have to focus on commercially available particles. Little is known about the uptake of nanoparticles in primary cells. Previously studies mostly reported cellular uptake in cell lines. Here we present a systematic study on the uptake of magnetic nanoparticles (MNPs) by primary cells of the nervous system.

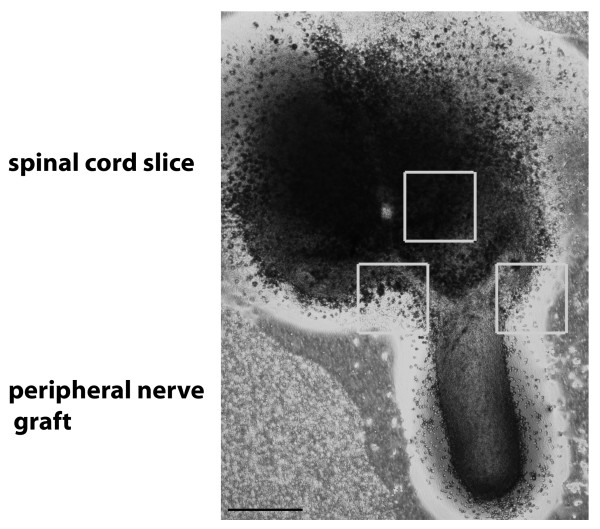
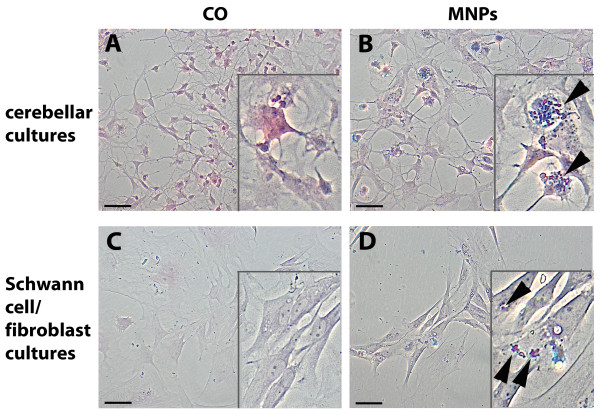
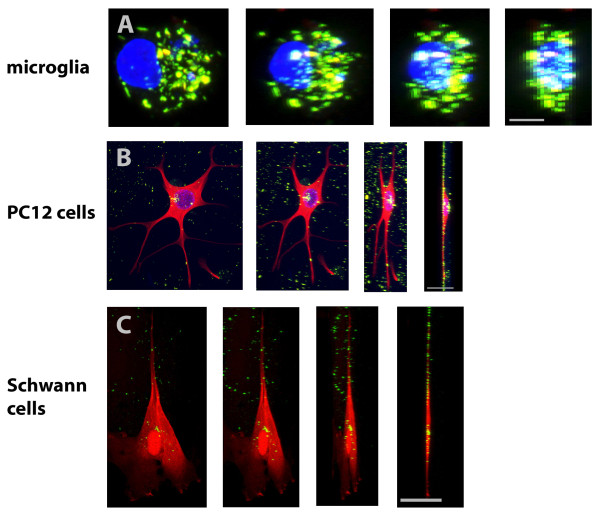
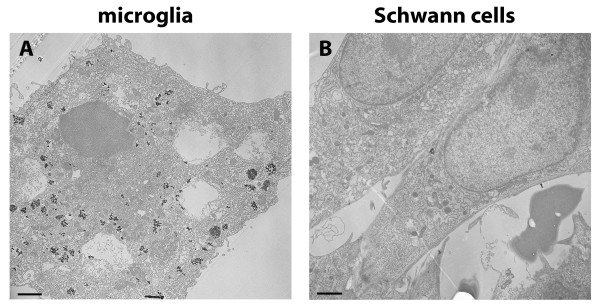
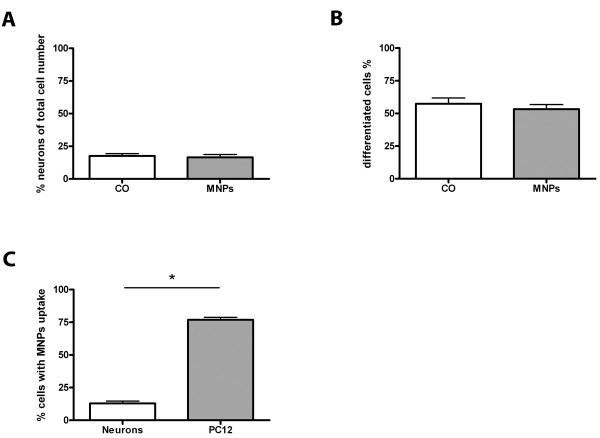
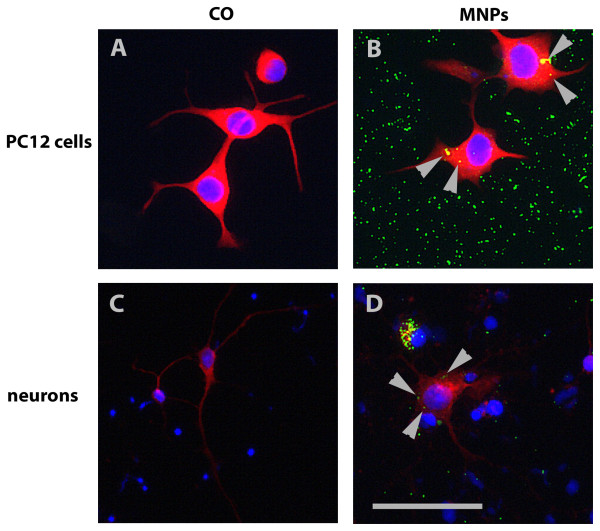
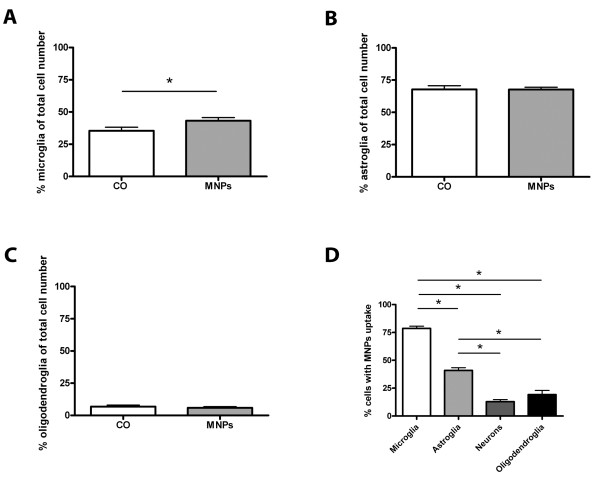
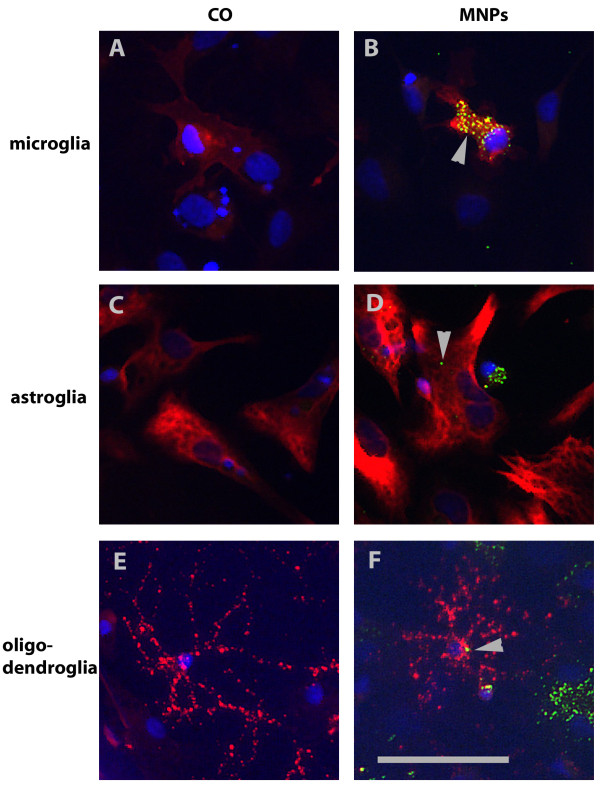
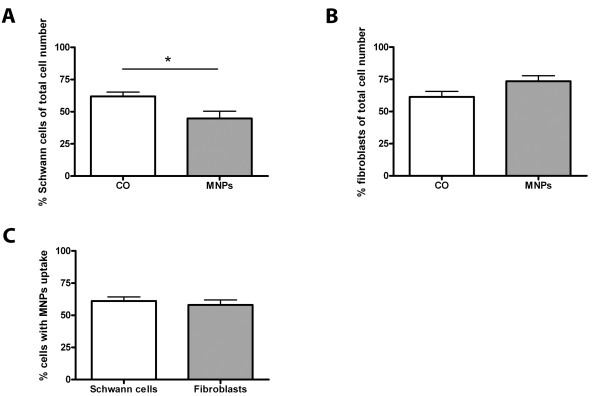
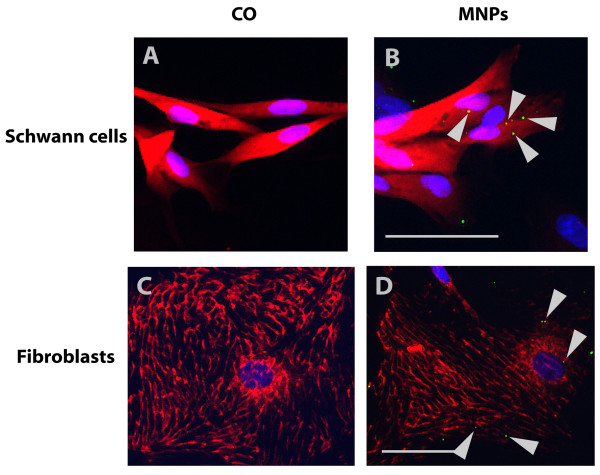
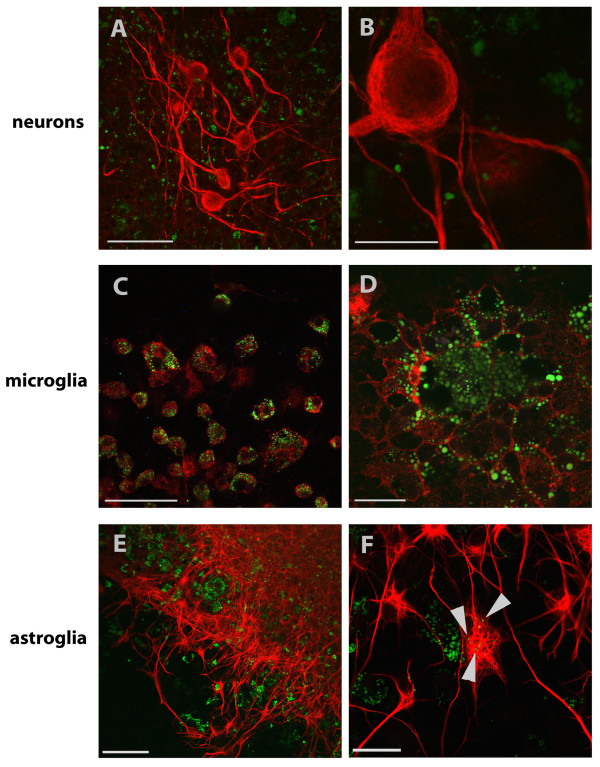
Results: We assessed the internalization in different cell types with confocal and electron microscopy. The analysis confirmed the uptake of MNPs in the cells, probably with endocytotic mechanisms. Furthermore, we compared the uptake in PC12 cells, a rat pheochromocytoma cell line, which is often used as a neuronal cell model, with primary neuronal cells. It was found that the percentage of PC12 cells loaded with MNPs was significantly higher than for neurons. Uptake studies in primary mixed neuronal/glial cultures revealed predominant uptake of MNPs by microglia and an increase in their number. The number of astroglia and oligodendroglia which incorporated MNPs was lower and stable. Primary mixed Schwann cell/fibroblast cultures showed similar MNP uptake of both cell types, but the Schwann cell number decreased after MNP incubation. Organotypic co-cultures of spinal cord slices and peripheral nerve grafts resembled the results of the dispersed primary cell cultures.

Conclusions: The commercial MNPs used activated microglial phagocytosis in both disperse and organotypic culture systems. It can be assumed that in vivo application would induce immune system reactivity, too. Because of this, their usefulness for in vivo neuroscientific implementations can be questioned. Future studies will need to overcome this issue with the use of cell-specific targeting strategies. Additionally, we found that PC12 cells took up significantly more MNPs than primary neurons. This difference indicates that PC12 cells are not a suitable model for natural neuronal uptake of nanoparticles and qualify previous results in PC12 cells.


Figures

Figure 1
Figure 1
Phase contrast of an organotypic co-culture of spinal cord and peripheral nerve graft. Boxes indicate imaged regions for confocal microscopic analysis of different cell types including neurons, microglia, astroglia, oligodendroglia and Schwann cells. Bar represents 500 μm.
Figure 2
Figure 2
Cellular visualization of MNPs. Primary cerebellar and Schwann cell/fibroblast cultures are stained with nuclear fast red-aluminium sulphate (visualizing the cells) and Prussian blue (visualizing MNPs). (A) shows control (CO) cerebellar cells and (B) cerebellar cells incubated with MNPs. (C) illustrates Schwann cell/fibroblast cultures of the control and (D) incubated with MNPs. Arrows indicate stained MNPs. Bars represent 50 μm.
Figure 3
Figure 3
Representative confocal 3-D-projections of cells. Representative confocal 3D projections of a microglial cell in (A), PC12 cell in (B) and Schwann cell in (C) with MNP uptake. Image rotation is shown from left (frontal) to right (side view). Green fluorescent MNPs rotated in correlation to the nucleus and cell bodies. Additionally, MNPs were coplanar to the cell bodies indicating real uptake of MNPs in the cells. Bar represents 5 μm in (A) and 25 μm in (B) and (C).
Figure 4
Figure 4
Electron microscopy of primary cells. Electron microscopy revealed accumulation of electronic dense MNPs in intracellular vesicular compartments, indicated by arrows. (A) shows a microglial cell of primary cerebellar cultures and (B) primary Schwann cells with uptake. Bars represent 2.5 μm.
Figure 5
Figure 5
Quantitative analysis of MNP uptake in PC12 cells and primary neurons. All values are expressed as mean ± SD. (A) compares the percentage of primary neurons in cerebellar cultures and (B) the percentage of differentiated PC12 cells of control cells and cells after MNP incubation. MNP incubation induced no changes in the number of neurons and PC12 cells. (C) compares the number of both cell types which took up MNPs. Significantly more PC12 cells took up MNPs than primary neurons.
Figure 6
Figure 6
Representative fluorescent images of PC12 cells and primary neurons. PC12 cells in (A) and (B) were stained with an anti-ß-III-tubulin antibody (in red). (A) shows control cells and (B) cells incubated with MNPs. Primary neurons in (C) and (D) were stained with an anti-MAP2 antibody (in red). (C) demonstrates control cells, (D) cells incubated with MNPs. MNPs are fluorescent green and marked with arrows. Bar represents 50 μm.
Figure 7
Figure 7
Quantitative analysis of mixed cerebellar cultures after 24 h incubation with 50 μg/ml MNPs. All values are expressed as mean ± SD. (A) shows the number of microglia of control cultures and cells incubated with MNPs after 24 h. The percentage of microglia increased significant with MNP incubation. The number of astroglia, shown in (B), was not influenced by MNPs. No significant differences between both groups were found for oligodendroglia in (C). In (D), a comparison of the uptake for all cell types is shown. The number of cells which took up MNPs was highest for microglia, followed by astroglia, oligodendroglia and neurons.
Figure 8
Figure 8
Representative fluorescent images of glia cells in cerebellar cultures. Cell type specific stainings are shown in red and MNPs in green (arrows). Microglia were stained with anti-CD11b/c, shown in (A) and (B), astroglia with anti-GFAP, in (C) and (D), and oligodendroglia with anti-GalC, in (E) and (F), antibodies. Glia cells in (A), (C) and (E) represent control cells, cells in (B), (D) and (F) were incubated with 50 μg/ml MNPs for 24 h. Bar represents 50 μm.
Figure 9
Figure 9
Quantitative analysis of primary Schwann cell/fibroblast cultures after 24 h incubation with 50 μg/ml MNPs. All values are expressed as mean ± SD. In (A), the number of Schwann cells is compared between cells of the control and cells incubated with MNPs. MNP incubation decreased the percentage of Schwann cells. The comparison of control cells and cells incubated with MNPs for fibroblasts is shown in (B). The number of fibroblasts in the cultures was not influenced by MNP incubation. (C) shows the comparison of the uptake for both cell types. The number of cells which took up MNPs was similar in both cell types.
Figure 10
Figure 10
Representative fluorescent images of all cell types of primary mixed Schwann cell/fibroblast cultures. Cell type specific stainings are shown in red and MNPs in green (arrows). Schwann cells in (A) and (B) are stained with anti-S100 antibody and fibroblasts in (C) and (D) with anti-fibronectin antibody. Images (A) and (C) illustrate control cells without MNPs and images (B) and (D) cells after MNP incubation. Bars represent 50 μm.
Figure 11
Figure 11
Immunohistochemical staining of organotypic spinal cord co-cultured with peripheral nerve graft. Co-cultures were incubated for one week with 100 μg/ml green fluorescent MNPs and were stained with anti-pan-neuronal neurofilament to visualize neurons, shown in images (A) and (B). Neurons do not display co-localization with green fluorescent MNPs. Microglia in (C) and (D) were visualized with the microglial marker anti-CD11b/c and demonstrated high amount of MNPs localized in vesicles. Astroglial cells in (E) and (F) were stained with anti-GFAP antibody and showed moderate MNP co localization (arrows). Bars in (A) and (E) represent 75 μm, in (C) 50 μm and in (B), (D) and (F) 25 μm.

References

    1. Li W, Chen C, Ye C, Wei T, Zhao Y, Lao F, Chen Z, Meng H, Gao Y, Yuan H, Xing G, Zhao F, Chai Z, Zhang X, Yang F, Han D, Tang X, Zhang Y. The translocation of fullerenic nanoparticles into lysosome via the pathway of clathrin-mediated endocytosis. Nanotechnol. 2008;19:145102. doi: 10.1088/0957-4484/19/14/145102. - DOI - PubMed
    1. Shi H, He X, Yuan Y, Wang K, Liu D. Nanoparticle-based biocompatible and long-life marker for lysosome labelling and tracking. Anal Chem. 2010;82:2213–2220. doi: 10.1021/ac902417s. - DOI - PubMed
    1. Pankhurst QA, Connolly J, Jones SK, Dobson J. Applications of magnetic nanoparticles in biomedicine. J Phys D-Appl Phys. 2003;36:R167–R181. doi: 10.1088/0022-3727/36/13/201. - DOI
    1. Gupta AK, Gupta M. Synthesis and surface engineering of iron oxide nanoparticles for biomedical applications. Biomaterials. 2005;26:3995–4021. doi: 10.1016/j.biomaterials.2004.10.012. - DOI - PubMed
    1. Suh WH, Suslick KS, Stucky GD, Suh Y-H. Nanotechnology, nanotoxicology, and neuroscience. Prog Neurobiol. 2009;87:133–170. doi: 10.1016/j.pneurobio.2008.09.009. - DOI - PMC - PubMed

Publication types

LinkOut - more resources