. 2012 Mar 20;21(3):402-17.
doi: 10.1016/j.ccr.2012.01.008.

Marginating dendritic cells of the tumor microenvironment cross-present tumor antigens and stably engage tumor-specific T cells

Affiliations

Marginating dendritic cells of the tumor microenvironment cross-present tumor antigens and stably engage tumor-specific T cells

John J Engelhardt et al. Cancer Cell. .

Abstract

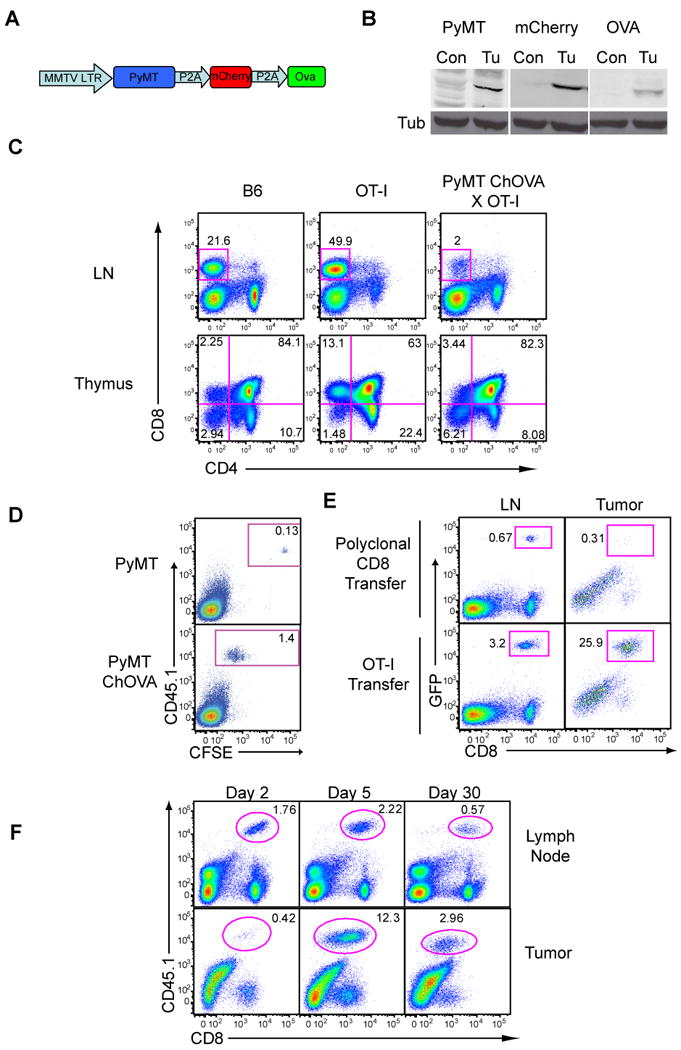
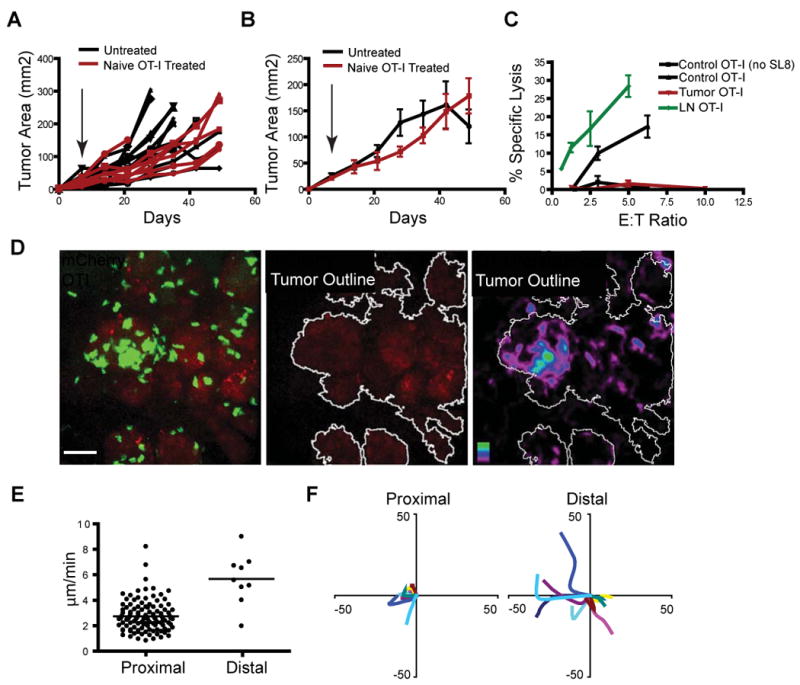
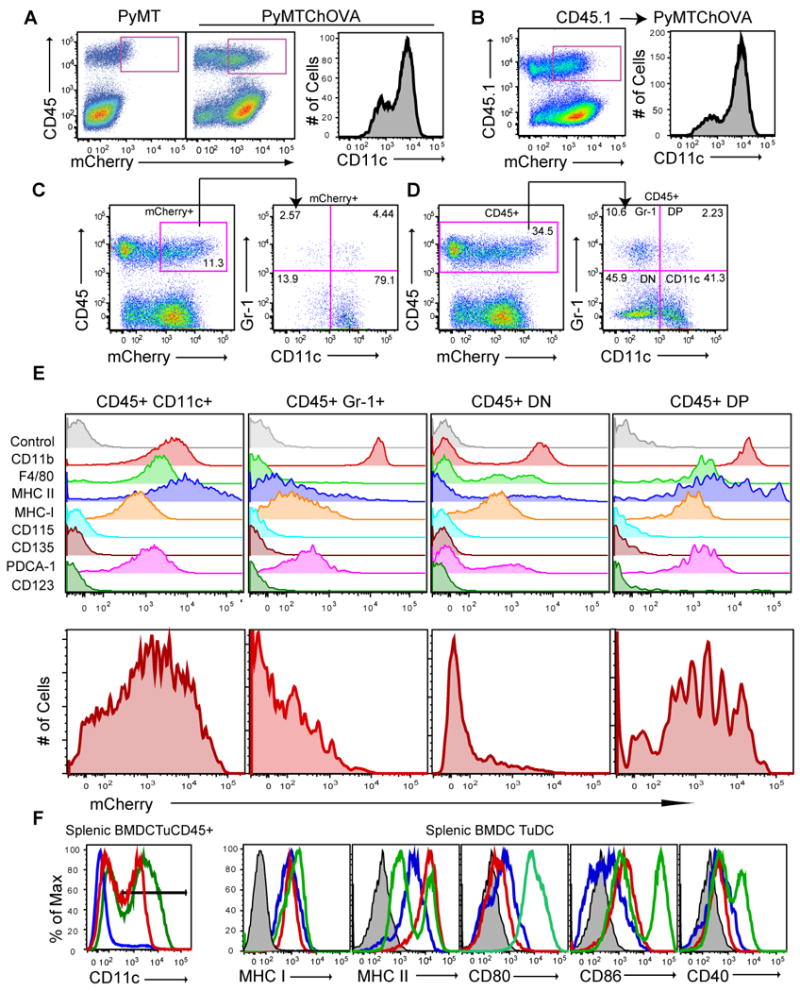
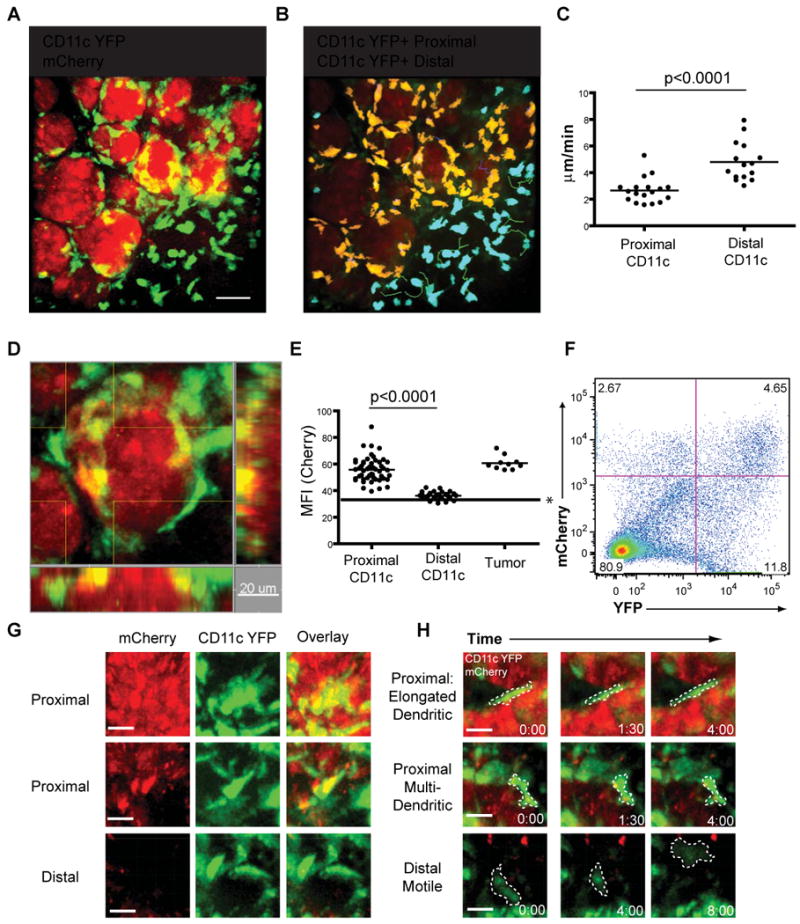
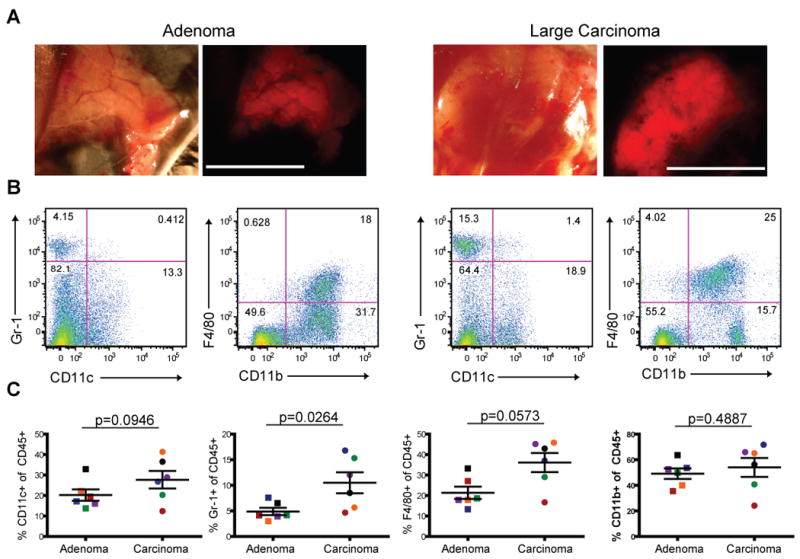
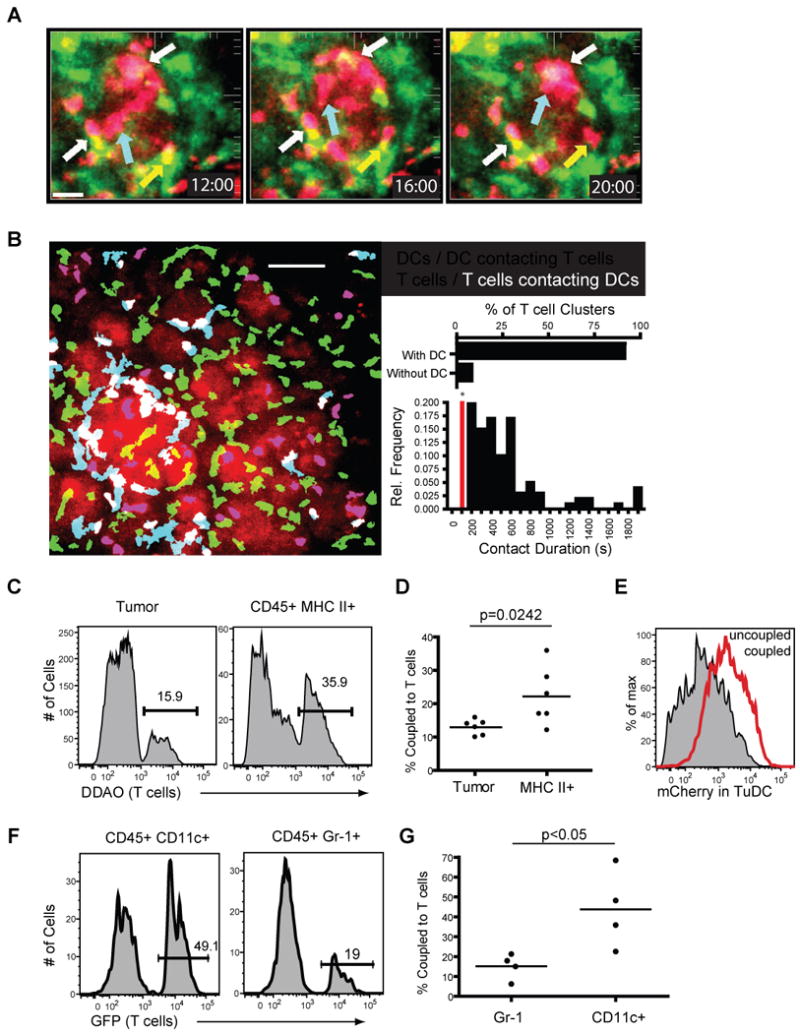
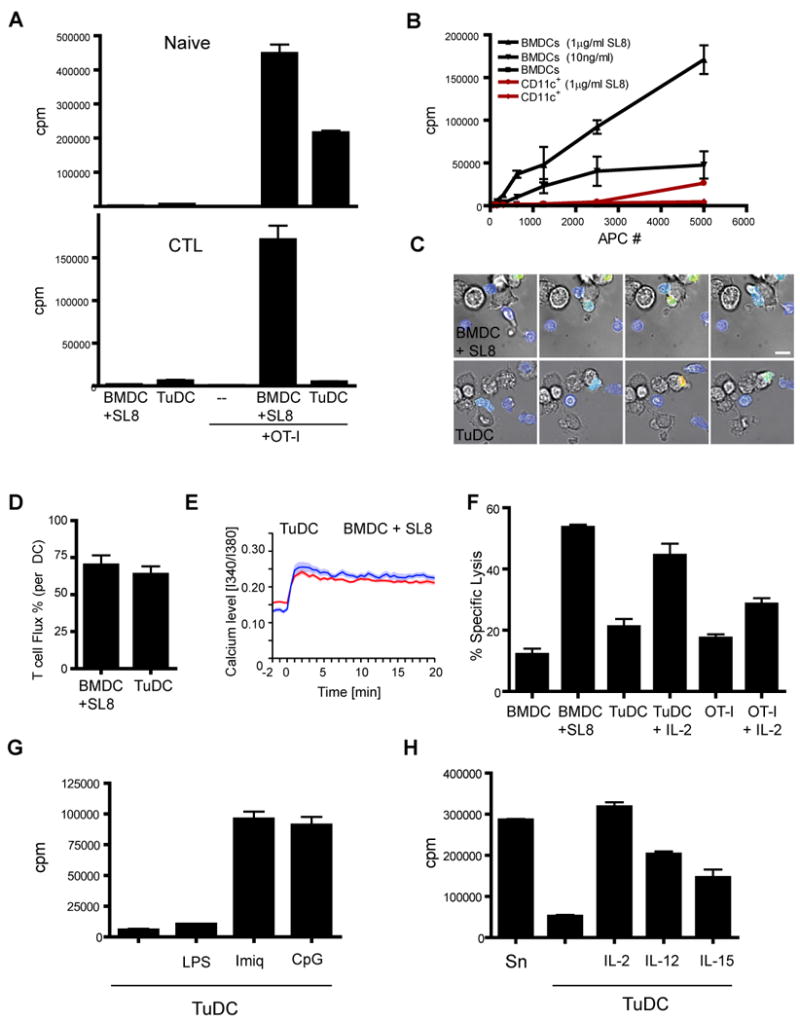
The nature and site of tumor-antigen presentation to immune T cells by bone-marrow-derived cells within the tumor microenvironment remains unresolved. We generated a fluorescent mouse model of spontaneous immunoevasive breast cancer and identified a subset of myeloid cells with significant similarity to dendritic cells and macrophages that constitutively ingest tumor-derived proteins and present processed tumor antigens to reactive T cells. Using intravital live imaging, we determined that infiltrating tumor-specific T cells engage in long-lived interactions with these cells, proximal to the tumor. In vitro, these cells capture cytotoxic T cells in signaling-competent conjugates but do not support full activation or sustain cytolysis. The spatiotemporal dynamics revealed here implicate nonproductive interactions between T cells and antigen-presenting cells on the tumor margin.


Figures

Figure 1
Figure 1. Recruitment and Ineffectiveness of Tumor-specific T cells in a Spontaneous Model of Breast Cancer
A. Schematic of PyMT ChOVA transgenic construct. B. Western blots displaying the expression of PyMT, mCherry and Ova from tumor cells and control T cells in PyMT ChOVA mice. C. Thymic negative selection of high-affinity TCRs in the PyMTChOVA spontaneous breast cancer model. Lymph nodes and thymii from either wild type B6, OT-I or PyMT ChOVA × OT-I mice were analyzed by flow cytometry for CD4 and CD8 expression. D. Flow cytometry of tumor-draining lymph nodes 48 hours after 1×10⁶ CFSE labeled CD45.1 OT-I T cells were transferred to either a PyMT tumor-bearing mouse or a PyMT ChOVA tumor-bearing mouse. E. 5×10⁶ OT-I-UbGFP T cells or polyclonal Ub-GFP CD8 T cells were transferred to a PyMT ChOVA tumor bearing mice. 5 days post-transfer tumor draining lymph nodes and tumors were removed and analyzed by flow cytometry. Plots from tumor were previously gated for CD45+ leukocytes. F. Tumor-bearing PyMT ChOVA mice received 1×10⁶ CD45.1 OT-I cells i.v., and were sacrificed at the specified day post-transfer. Tumor draining lymph nodes and tumor were removed and analyzed by flow cytometry. Plots from tumor were previously gated for CD45+ leukocytes. See also Figure S1.
Figure 2
Figure 2. Tumor-specific T cells are Defective in their Ability to Eliminate PyMT ChOVA tumors
A. Tumor burden in individual PyMT ChOVA mice following adoptive transfer of 5×10⁶ naïve OT-I cells (red lines, N=7) or untreated controls (black line, N=12). Arrow indicates date of adoptive transfer. B. Average combined tumor burden in PyMT ChOVA mice following adoptive transfer of 5×10⁶ naïve OT-I cells (red line mean +/- SEM, N=7) or untreated controls (black line mean +/- SEM, N=12). C. Cytotoxic activity of OT-I T cells isolated from the LNs (green), or tumor (red) of PyMTChOva mice 5 days after adoptive transfer, compared to in vitro activated control OT-I T cells (black line with triangles) or control OT-I lysis of unpulsed EL4s (black line with squares). 104 EL-4 cells (+/- 100 ng/ml SL8 peptide-pulse) were used as targets. All lines mean +/- SEM, N=3. D. Spinning disc confocal live-imaging of OT-I GFP T cells five days after adoptive transfer into PyMT ChOVA mice. Representative image of T cell localization at the site of a mCherry fluorescent tumor (left), image displaying tumor area outlined using a threshold mask (middle), and time average image of T cell persistence at the tumor site with tumors outlined (right). Scale bar represents 50 μm. E. Average velocity of individual T cell tracks of cells located proximal (within 5 μm) or distal to the tumor. F. Representative displacement tracks from T cells located either proximal (within 5 μm) or distal to the tumor border. See also Movie S1
Figure 3
Figure 3. Phenotypic Characterization of Tumor-antigen Cross-presenting Dendritic Cells
A. Flow cytometry of CD45 expression versus mCherry levels from digested tumors from PyMT (left) or PyMT ChOVA (middle) mice. CD11c levels of gated CD45+ mCherry+ cells (right) from previous dot plot. B. As A, but from bone marrow chimera made by adoption of CD45.1 bone marrow cells into an irradiated PyMT ChOVA mouse. C. CD45 expression versus mCherry levels from digested tumor from PyMT ChOVA mouse, gated CD45+ mCherryhi cells were propagated to subsequent dot plot, and analyzed for their expression of CD11c and Gr-1. D. CD45 expression versus mCherry levels from digested tumor from PyMT ChOVA mouse, gated CD45+ cells were propagated to subsequent dot plot and analyzed for their expression of CD11c and Gr-1. E. Gated and labeled populations from D. were analyzed for their expression of the listed cell surface markers or for their mCherry fluorescence level. F. CD11c+ cells from either the spleen of B6 mice, BMDC cultures or the tumor of PyMT ChOVA mice. Gate in left histogram propagated to subsequent histograms.
Figure 4
Figure 4. Live Imaging of Tumor-Dendritic Cell Behavior
A. Representative still image acquired by intravital spinning disc confocal microscopy of mCherry+ CD11c YFP+ dendritic cells in PyMT ChOVA × CD11c YFP mice. Scale bar represents 10 μm. B. DCs are color coded based on their proximity to the tumor border. Proximal DCs (within 5μm) are coded yellow, distal DCs (>5μm from tumor border) are coded blue. Color coded DCs with representative tracks of their movement during imaging. C. Average velocity of individual CD11c YFP+ cells located proximal or distal to the tumor border. D. Representative still image acquired by intravital spinning disc confocal microscopy of mCherry+ CD11c YFP+ dendritic cells in PyMT ChOVA × CD11c YFP mice. E. Mean fluorescent intensity of CD11c YFP+ cells located proximal or distal to the tumor border, and tumor masses. * line represents background fluorescence of image. F. Flow cytometry analysis of CD11c-YFP × PyMT ChOVA mouse displaying CD11c YFP+ mCherry+ DCs. G. Representative YFP, mCherry and overlay still images of DCs either proximal or distal to the tumor. Scale bar represents 10μm. H. Representative still images of YFP+ cells displaying either dendritic like or motile cell behaviors. Cell outlines are marked in dashed line. Scale bar represents 10 μm. See also Movies S2 and S3.
Figure 5
Figure 5. Alteration of Leukocytic Infiltrate with Tumor Development
A. Transmitted and mCherry-fluorescent images of tumors from PyMT ChOVA mouse taken on a dissecting scope. Scale bar represents 1cm. B. Cells from either an adenoma or a late carcinoma tumor were dissociated and analyzed by flow cytometry. CD45+ cells were analysed for the cell surface markers CD11c, Gr-1, CD11b and F4/80. C. Plots depict percent+ of specified cell surface markers out of total CD45+ cells from different stage tumors. Each data point represents one tumor, and matched colors indicate tumors were from the same mouse.
Figure 6
Figure 6. Tumor DCs Interact with Tumor-specific T cells in vitro and in vivo
A. Spinning disc confocal imaging of CD2RFP OT-I T cells 5 days after adoptive transfer to PyMT ChOVA × CD11c-YFP mice. A representative image sequence of CD2RFP T cells (red) interacting with CD11c -YFP (green) dendritic cells at the tumor site, white arrows indicate T cells interacting with DCs throughout the time lapse, yellow arrows indicate T cell leaving a DC interaction, blue arrows indicate a T cell moving to a DC. Scale bar represents 30 μm. B. Representative image displaying T cells (red) and DCs (green) at the tumor site. Blue cells indicate DCs contacting T cells (defined by overlapping red and green fluorescence), white cells indicate T cells contacting DCs. Scale bar represents 50 μm. Inset/top. Graph of the number of T cell clusters (defined as stable groups of greater than 2 T cells) that occur with DCs present or without DCs being present Inset/bottom. Relative frequency of contact duration between OT-I T cells and TuDCs. Pairs with contact durations lower than 200 s were not considered. C. Histogram displaying the percentage of tumor cells (left) or MHC II+ cells (right) from PyMT ChOVA tumors that form couples with DDAO labeled T cells. D. Results from 6 separate coupling assays plotted as percent of tumor or MHC II+ cells coupled to T cells. Bar represents mean. E. mCherry fluorescence of CD45+ MHC class II+ cells that were not coupled to T cells (shaded histogram) or were coupled to T cells (red histogram). F. Histogram displaying the percentage of mCherry CD11c+ or CD45+ Gr-1+ cells that form couples with OT-I GFP T cells. G. Results from 4 separate coupling assays plotted as percent of CD11c or GR-1+ cells coupled to T cells. (Bar represents mean.) See also Figure S2 and Movies S4 and S5.
Figure 7
Figure 7. Tumor DCs Activate Naïve but not Previously Activated OT-I T cells
A. Proliferation of either naïve (upper) or previously activated (lower) OT-I T cells activated with either sorted TuDCs (50,000) or BMDCs (5,000) pulsed with 100 ng/ml SL8 peptide. N=3 mean +/- SEM. B. Proliferation of previously activated OT-I T cells cultured with varying numbers of TuDCs or BMDCs pulsed with the specified amount of SL8 peptide. N=3 mean +/- SEM. C. Live imaging of previously activated and Fura-2 labeled OT-I T cells interacting with BMDCs pulsed with 100 ng/ml SL8 peptide or with TuDCs. Brightfield images are overlaid with a pseudocolor image of the ratiometric Fura-2 fluorescence values, representing low intracellular calcium levels in blue and high intracellular calcium in red. Scale bar represents 10 μm. D. Frequency of cell contacts with SL8 peptide-pulsed BMDCs or TuDCs that lead to calcium transients in previously activated OT-I T cells. N=3 mean +/- SEM. E. Intracellular calcium levels of previously activated OT-I T cells contacting BMDCs pulsed with 100 ng/ml SL8 peptide or TuDC. Mean values with standard error are shown. F. Cytolytic activity of in vitro activated T cells after overnight culture with BMDCs, TuDCs or BMDCs pulsed with 100 ng/ml SL8 peptide. N=3 mean +/- SEM. G. Proliferation of OT-I T cells cultured with TuDCs alone or TuDCs with the TLR ligands, LPS (1 μg/ml), Imiquimod (2.5 μg/ml) or CpG (10 μg/ml). N=3 mean +/- SEM. H. Proliferation of OT-I T cells cultured with either control splenocytes pulsed with 100 ng/ml SL8 peptide or TuDCs alone or in the presence of IL-2 (3U/ml), IL-12(10ng/ml) or IL-15(10ng/ml). N=3 mean +/- SEM See also Figure S3 and Movies S6 and S7.

References

    1. Adler AJ, Marsh DW, Yochum GS, Guzzo JL, Nigam A, Nelson WG, Pardoll DM. CD4+ T cell tolerance to parenchymal self-antigens requires presentation by bone marrow-derived antigen-presenting cells. J Exp Med. 1998;187:1555–1564. - PMC - PubMed
    1. Ambe K, Mori M, Enjoji M. S-100 protein-positive dendritic cells in colorectal adenocarcinomas. Distribution and relation to the clinical prognosis. Cancer. 1989;63:496–503. - PubMed
    1. Anderson MJ, Shafer-Weaver K, Greenberg NM, Hurwitz AA. Tolerization of tumor-specific T cells despite efficient initial priming in a primary murine model of prostate cancer. Journal of Immunology. 2007;178:1268–76. - PubMed
    1. Bruggen P van der, Traversari C, Chomez P, Lurquin C, Plaen E De, Eynde B Van den, Knuth A, Boon T. A gene encoding an antigen recognized by cytolytic T lymphocytes on a human melanoma. Science. 1991;254:1643–1647. - PubMed
    1. DeNardo DG, Barreto JB, Andreu P, Vasquez L, Tawfik D, Kolhatkar N, Coussens LM. CD4(+) T cells regulate pulmonary metastasis of mammary carcinomas by enhancing protumor properties of macrophages. Cancer cell. 2009;16:91–102. - PMC - PubMed

Publication types

Substances