

Calf muscle characteristics, strength measures, and mortality in peripheral arterial disease: a longitudinal study
- PMID: 22440216
- PMCID: PMC3465664
- DOI: 10.1016/j.jacc.2011.12.019
Calf muscle characteristics, strength measures, and mortality in peripheral arterial disease: a longitudinal study
Abstract
Objectives: This study analyzed whether lower calf muscle density and poorer upper and lower extremity strength are associated with higher mortality rates in men and women with peripheral arterial disease (PAD).
Background: Men and women with lower extremity PAD have lower calf muscle density and reduced lower extremity strength compared with individuals without PAD.
Methods: At baseline, participants underwent measurement of calf muscle density with computed tomography in addition to knee extension power and isometric knee extension, plantar flexion, and hand grip strength measures. Participants were followed up annually for up to 4 years. Results were adjusted for age, sex, race, body mass index, ankle-brachial index, smoking, physical activity, and comorbidities.
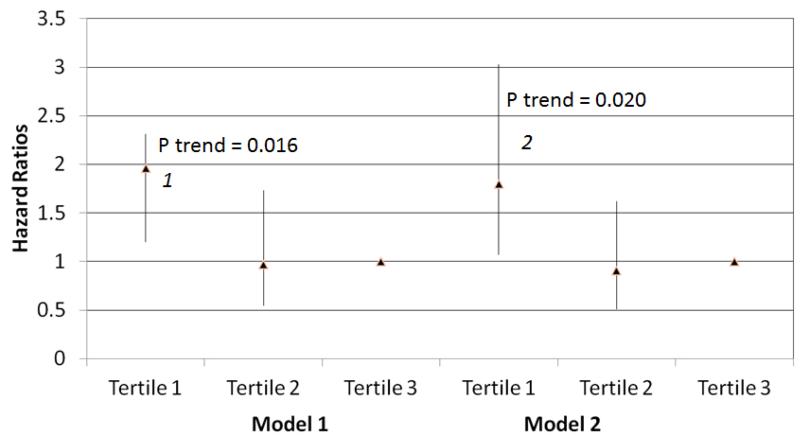
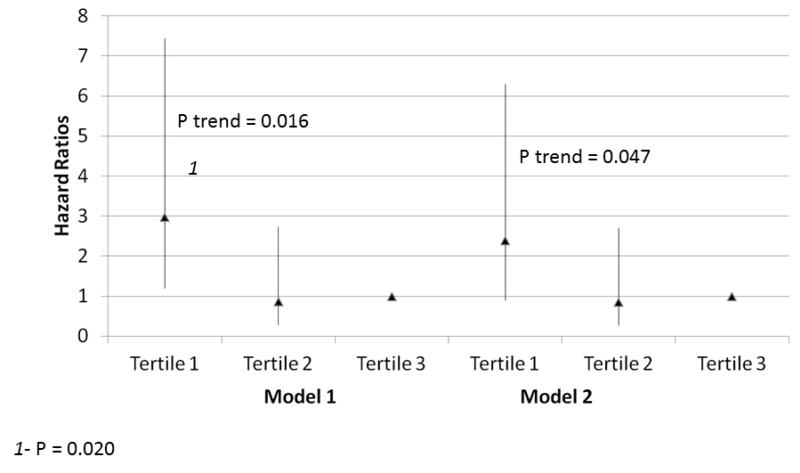
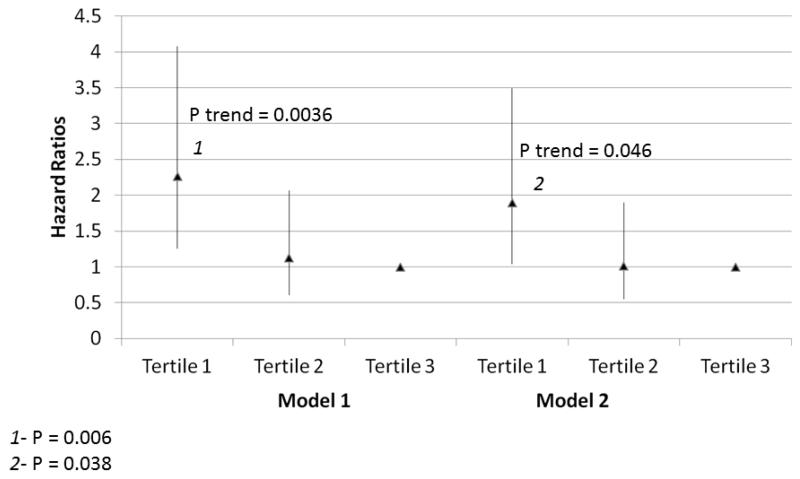
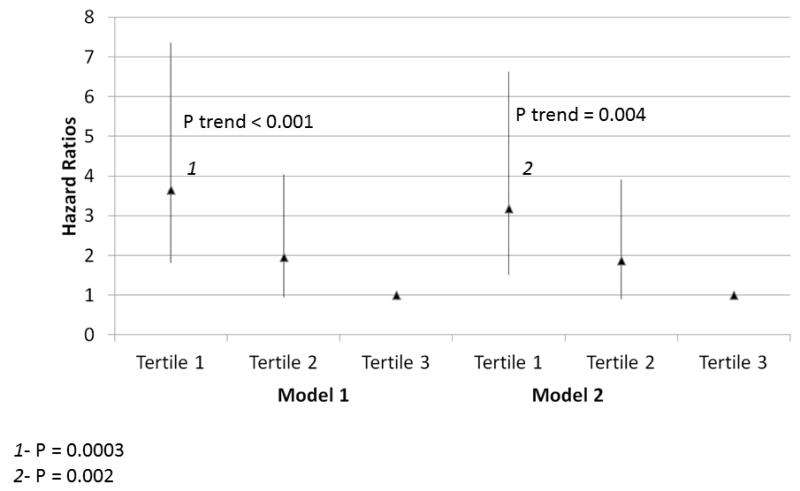
Results: Among 434 PAD participants, 103 (24%) died during a mean follow-up of 47.6 months. Lower calf muscle density was associated with higher all-cause mortality (lowest density tertile hazard ratio [HR]: 1.80 [95% confidence interval (CI): 1.07 to 3.03], second tertile HR: 0.91 (95% CI: 0.51 to 1.62); highest density tertile HR: 1.00; p trend = 0.020) and higher cardiovascular disease mortality (lowest density tertile HR: 2.39 [95% CI: 0.90 to 6.30], second tertile HR: 0.85 [95% CI: 0.27 to 2.71]; highest density tertile HR: 1.00; p trend = 0.047). Poorer plantar flexion strength (p trend = 0.004), lower baseline leg power (p trend = 0.046), and poorer handgrip (p trend = 0.005) were associated with higher all-cause mortality.
Conclusions: These data demonstrate that lower calf muscle density and weaker plantar flexion strength, knee extension power, and hand grip were associated with increased mortality in these participants with PAD, independently of the ankle-brachial index and other confounders.
Copyright © 2012 American College of Cardiology Foundation. Published by Elsevier Inc. All rights reserved.
Figures
References
-
- Allison MA, Ho E, Denenberg JO, et al. Ethnic-specific prevalence of peripheral arterial disease in the United States. Am J Prev Med. 2007;32:328–333. - PubMed
-
- McDermott MM, Greenland P, Liu K, et al. The ankle brachial index is associated with leg function and physical activity: the Walking and Leg Circulation Study. Ann Intern Med. 2002;136:873–883. - PubMed
-
- McDermott MM, Liu K, Greenland P, et al. Functional decline in peripheral arterial disease: Associations with the ankle brachial index and leg symptoms. JAMA. 2004;292:453–461. - PubMed
-
- Regensteiner JG, Wolfel EE, Brass EP, et al. Chronic changes in skeletal muscle histology and function in peripheral arterial disease. Circulation. 1993;87:413–421. - PubMed
Publication types
MeSH terms
Grants and funding
LinkOut - more resources
Full Text Sources
