

The tumor microenvironment strongly impacts master transcriptional regulators and gene expression class of glioblastoma
- PMID: 22440258
- PMCID: PMC3354586
- DOI: 10.1016/j.ajpath.2012.01.040
The tumor microenvironment strongly impacts master transcriptional regulators and gene expression class of glioblastoma
Abstract
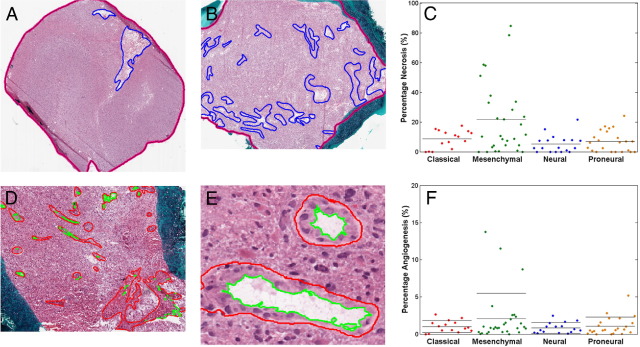
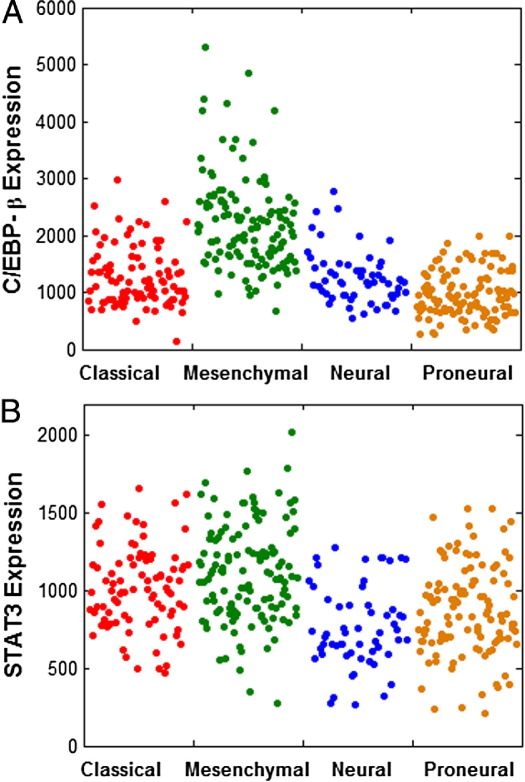
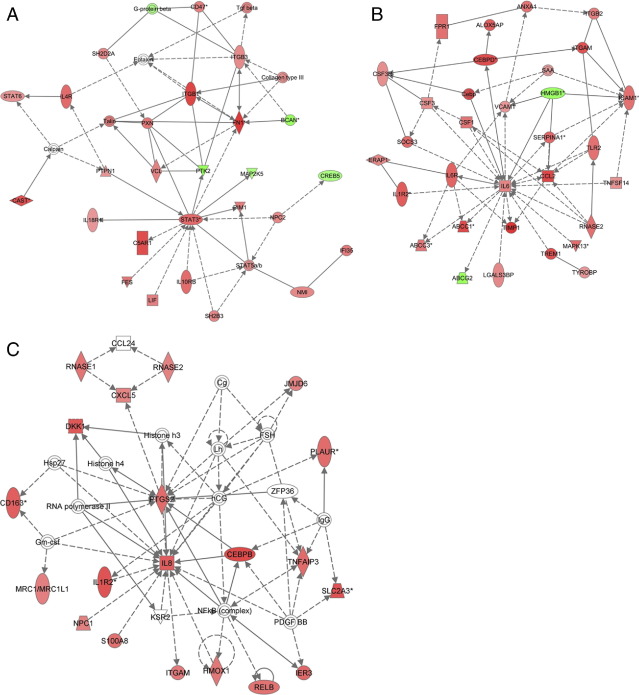
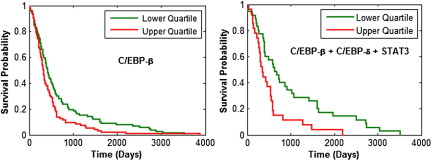
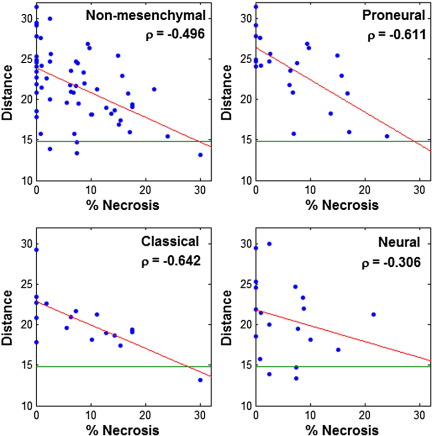
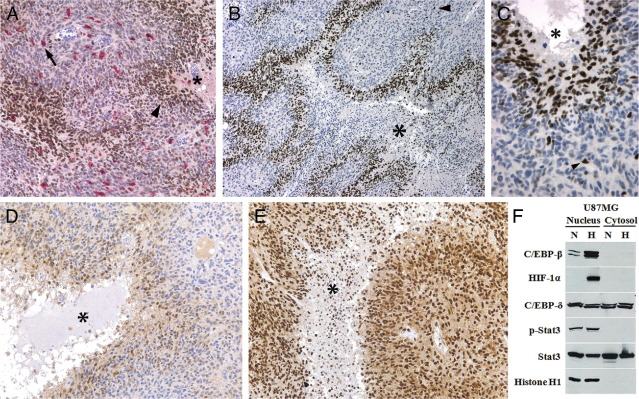
The Cancer Genome Atlas (TCGA) project has generated gene expression data that divides glioblastoma (GBM) into four transcriptional classes: proneural, neural, classical, and mesenchymal. Because transcriptional class is only partially explained by underlying genomic alterations, we hypothesize that the tumor microenvironment may also have an impact. In this study, we focused on necrosis and angiogenesis because their presence is both prognostically and biologically significant. These features were quantified in digitized histological images of TCGA GBM frozen section slides that were immediately adjacent to samples used for molecular analysis. Correlating these features with transcriptional data, we found that the mesenchymal transcriptional class was significantly enriched with GBM samples that contained a high degree of necrosis. Furthermore, among 2422 genes that correlated with the degree of necrosis in GBMs, transcription factors known to drive the mesenchymal expression class were most closely related, including C/EBP-β, C/EBP-δ, STAT3, FOSL2, bHLHE40, and RUNX1. Non-mesenchymal GBMs in the TCGA data set were found to become more transcriptionally similar to the mesenchymal class with increasing levels of necrosis. In addition, high expression levels of the master mesenchymal factors C/EBP-β, C/EBP-δ, and STAT3 were associated with a poor prognosis. Strong, specific expression of C/EBP-β and C/EBP-δ by hypoxic, perinecrotic cells in GBM likely account for their tight association with necrosis and may be related to their poor prognosis.
Copyright © 2012 American Society for Investigative Pathology. Published by Elsevier Inc. All rights reserved.
Figures
Comment in
-
Nature versus nurture in glioblastoma: microenvironment and genetics can both drive mesenchymal transcriptional signature.Am J Pathol. 2012 May;180(5):1768-71. doi: 10.1016/j.ajpath.2012.03.001. Epub 2012 Mar 23. Am J Pathol. 2012. PMID: 22449951 Free PMC article.
References
-
- CBTRUS . Central Brain Tumor Registry of the United States; Hinsdale, IL: 2010. CBTRUS statistical report: primary brain and central nervous system tumors in the United States in 2004–2006.
-
- Stupp R., Mason W.P., van den Bent M.J., Weller M., Fisher B., Taphoorn M.J., Belanger K., Brandes A.A., Marosi C., Bogdahn U., Curschmann J., Janzer R.C., Ludwin S.K., Gorlia T., Allgeier A., Lacombe D., Cairncross J.G., Eisenhauer E., Mirimanoff R.O. Radiotherapy plus concomitant and adjuvant temozolomide for glioblastoma. N Engl J Med. 2005;352:987–996. - PubMed
-
- Phillips H.S., Kharbanda S., Chen R., Forrest W.F., Soriano R.H., Wu T.D., Misra A., Nigro J.M., Colman H., Soroceanu L., Williams P.M., Modrusan Z., Feuerstein B.G., Aldape K. Molecular subclasses of high-grade glioma predict prognosis, delineate a pattern of disease progression, and resemble stages in neurogenesis. Cancer Cell. 2006;9:157–173. - PubMed
-
- Verhaak R.G., Hoadley K.A., Purdom E., Wang V., Qi Y., Wilkerson M.D., Miller C.R., Ding L., Golub T., Mesirov J.P., Alexe G., Lawrence M., O'Kelly M., Tamayo P., Weir B.A., Gabriel S., Winckler W., Gupta S., Jakkula L., Feiler H.S., Hodgson J.G., James C.D., Sarkaria J.N., Brennan C., Kahn A., Spellman P.T., Wilson R.K., Speed T.P., Gray J.W., Meyerson M., Getz G., Perou C.M., Hayes D.N. Integrated genomic analysis identifies clinically relevant subtypes of glioblastoma characterized by abnormalities in PDGFRA. IDH1, EGFR, and NF1. Cancer Cell. 2010;17:98–110. - PMC - PubMed
Publication types
MeSH terms
Substances
Grants and funding
- R01 CA086335/CA/NCI NIH HHS/United States
- CA116804/CA/NCI NIH HHS/United States
- R01 CA149107/CA/NCI NIH HHS/United States
- CA149107/CA/NCI NIH HHS/United States
- P30 CA138292/CA/NCI NIH HHS/United States
- UL1 TR000454/TR/NCATS NIH HHS/United States
- LM011119/LM/NLM NIH HHS/United States
- R01 LM011119/LM/NLM NIH HHS/United States
- CA86335/CA/NCI NIH HHS/United States
- CA138292/CA/NCI NIH HHS/United States
- R01 CA116804/CA/NCI NIH HHS/United States
- N01 CO012400/CA/NCI NIH HHS/United States
- HHSN261200800001C/RC/CCR NIH HHS/United States
- UL1 RR025008/RR/NCRR NIH HHS/United States
- N01-CO-12400/CO/NCI NIH HHS/United States
- HHSN261200800001E/CA/NCI NIH HHS/United States
LinkOut - more resources
Full Text Sources
Miscellaneous
