. 2012 Apr 4;15(4):534-44.
doi: 10.1016/j.cmet.2012.02.011. Epub 2012 Mar 20.

Autophagy links inflammasomes to atherosclerotic progression

Affiliations

Autophagy links inflammasomes to atherosclerotic progression

Babak Razani et al. Cell Metab. .

Abstract

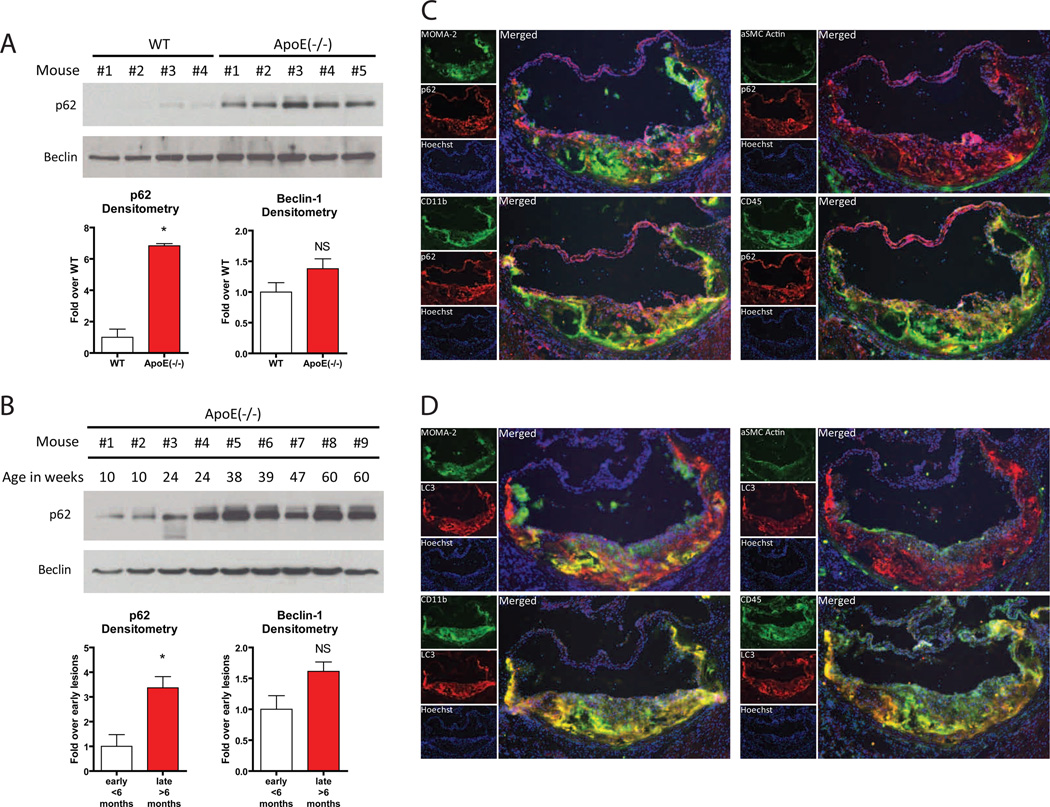
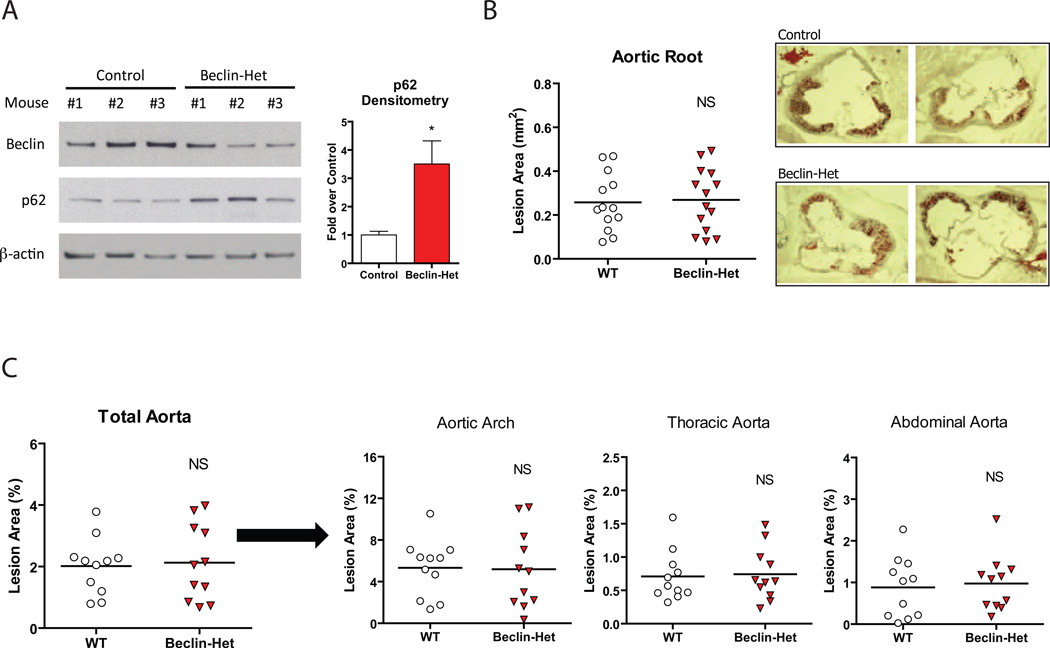
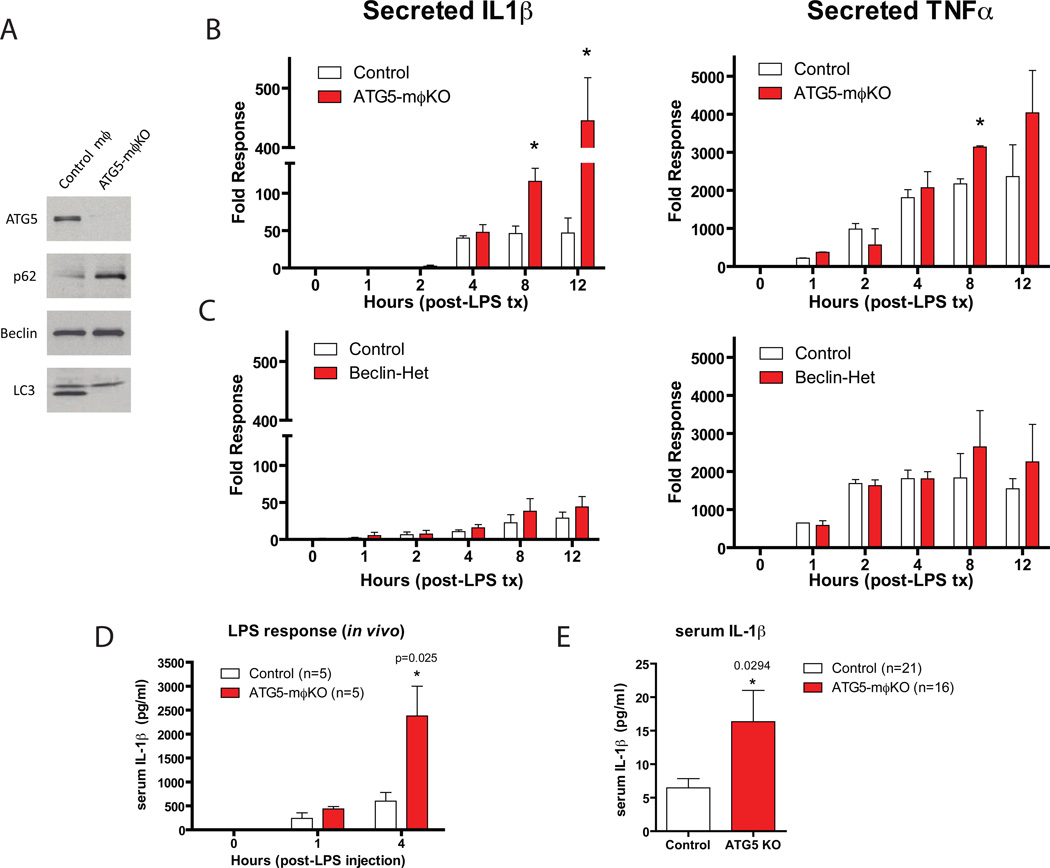
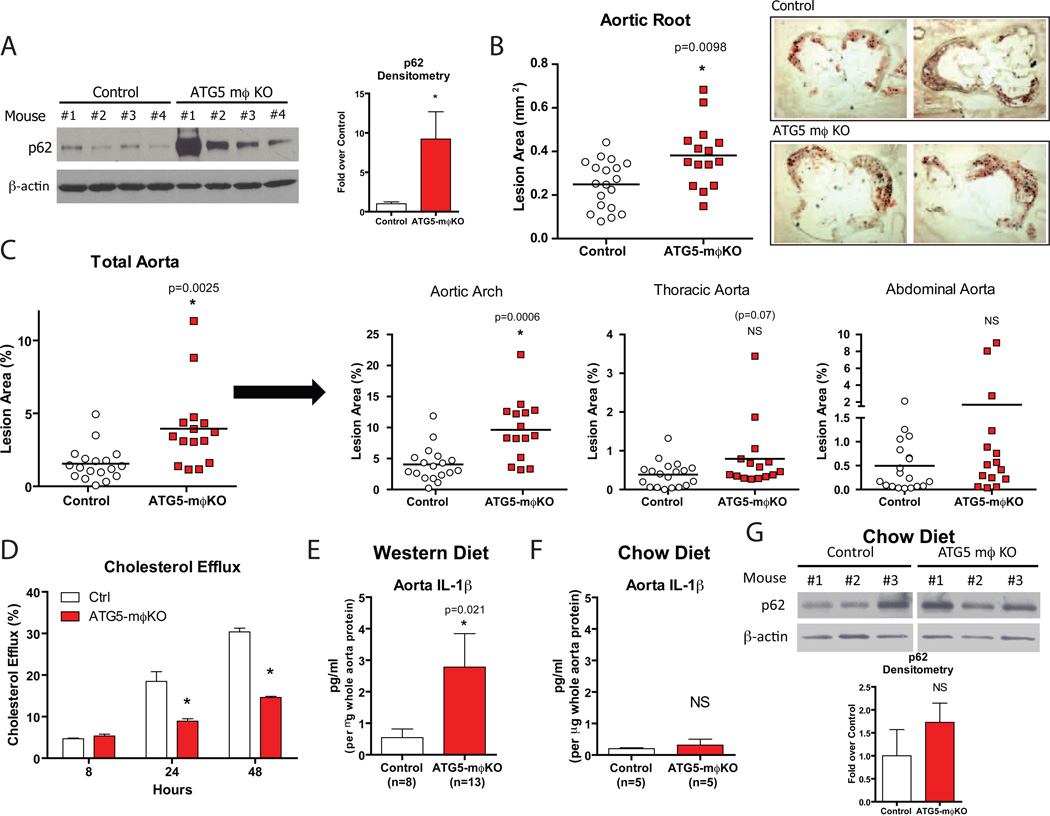
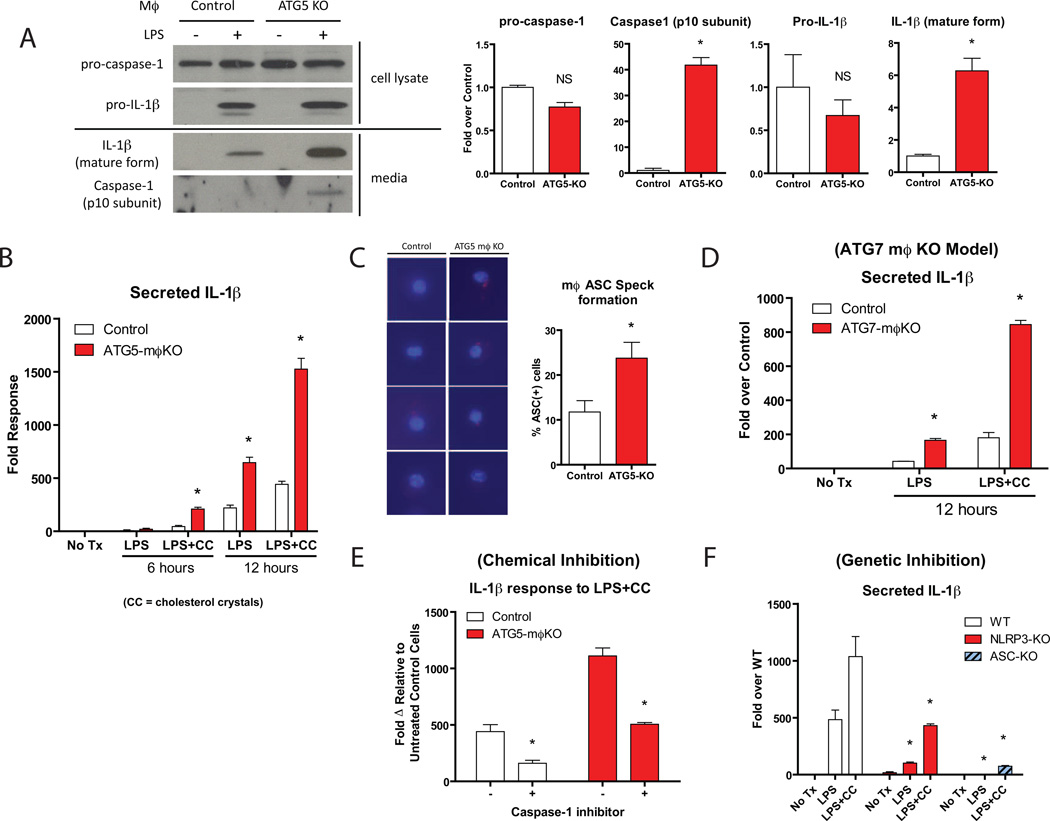
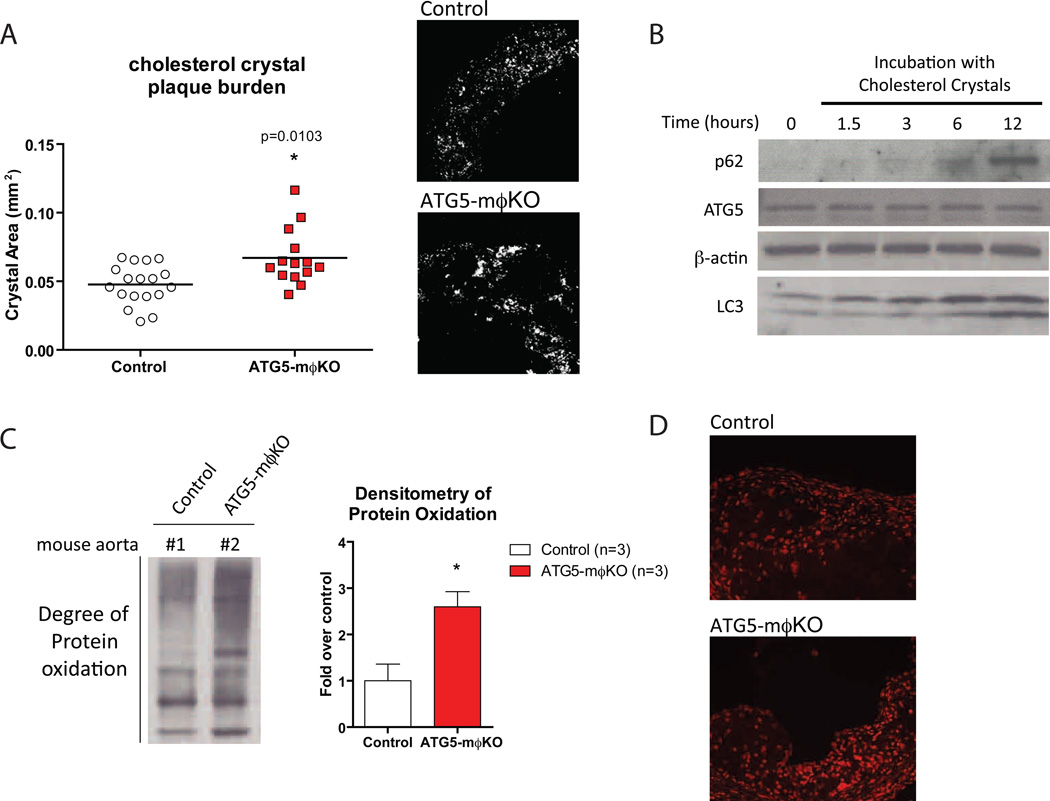
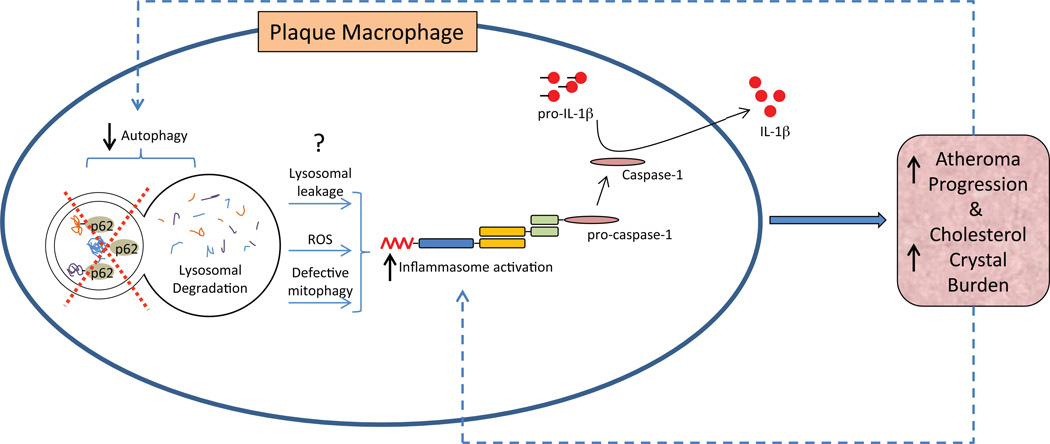
We investigated the role of autophagy in atherosclerosis. During plaque formation in mice, autophagic markers colocalized predominantly with macrophages (mφ). Atherosclerotic aortas had elevated levels of p62, suggesting that dysfunctional autophagy is characteristic of plaques. To determine whether autophagy directly influences atherogenesis, we characterized Beclin-1 heterozygous-null and mφ-specific ATG5-null (ATG5-mφKO) mice, commonly used models of autophagy haploinsufficiency and deficiency, respectively. Haploinsufficent Beclin-1 mice had no atherosclerotic phenotype, but ATG5-mφKO mice had increased plaques, suggesting an essential role for basal levels of autophagy in atheroprotection. Defective autophagy is associated with proatherogenic inflammasome activation. Classic inflammasome markers were robustly induced in ATG5-null mφ, especially when coincubated with cholesterol crystals. Moreover, cholesterol crystals appear to be increased in ATG5-mφKO plaques, suggesting a potentially vicious cycle of crystal formation and inflammasome activation in autophagy-deficient plaques. These results show that autophagy becomes dysfunctional in atherosclerosis and its deficiency promotes atherosclerosis in part through inflammasome hyperactivation.


Figures

Figure 1
Figure 1. Assessment of Autophagy in the Atherosclerotic Plaque
(A, B) Western blot analysis of p62 and Beclin-1 in whole aorta lysates from (A) wild type (WT, n=4) and ApoE-null (n=5) mice fed a Western diet for 2 months, and (B) ApoE-null mice of increasing age (10 to 60 weeks). Densitometric quantification is shown below each respective Western blot. Data are presented as mean ± SEM. *P<0.05, NS = not significant. (C, D) Immunofluorescence microscopy of aortic root frozen sections from an ApoE-null mouse fed a Western diet for 2 months. (C) In all quadrants, p62 stains (red) and Hoechst-33258 nuclear stains (purple) are shown. Green stains are as follows: MOMA-2 (left upper panel), CD11b (left lower panel), αSMC-Actin (right upper panel), and CD45 (right lower panel). (D) Similar stains to (B) except LC3/ATG8 staining (red) instead of p62. For all panels, smaller individual stains for each protein (labeled) are shown on the left and a larger merged image is shown on the right.
Figure 2
Figure 2. Quantification of Atherosclerosis in the Beclin-Het Autophagy-Deficient Model
(A) Western blot analysis of Beclin-1, p62, and β-actin in whole aorta lysates from control (n=3) and Beclin-Het (n=3) mice each on an ApoE-null background fed a Western diet for 2 months. Densitometric quantification is shown to the right. Data are presented as mean ± SEM. *P<0.05. (B, C) Cohorts of control and Beclin-Het mice (# of mice shown) were placed on a Western diet for 2 months and atherosclerotic area involvement was determined by computer image analyses. (B) Oil Red O-stained sections of aortic roots (representative aortic root sections are shown on the right). (C) En face results for the total aorta and its regions (aortic arch, thoracic aorta, and abdominal aorta). Horizontal lines within the data sets represent means. NS = not significant.
Figure 3
Figure 3. Comparison of the Pro-inflammatory Response of Beclin-Het and ATG5-mϕKO Macrophages
Experiments in (A–C) utilized cultured thioglycollate-elicited peritoneal macrophages. (A) Western blot analysis of ATG5, p62, Beclin-1, and LC3 expression in macrophages derived from control vs. ATG5-mϕKO mice. (B) Macrophages from control vs. ATG5-mϕKO mice treated with LPS (100 ng/ml) for the indicated times (in hours). Cell culture supernatants were assayed for IL-1β (left panel) and TNF-α (right panel) concentration by ELISA. (C) Experiments identical to (B) except using macrophages from control vs. Beclin-Het mice. Experiments were performed in duplicate. (D) Cohorts of control and ATG5-mϕKO mice were injected intraperitoneally with LPS (3.5 mg/g) and serum IL-1β at the indicated time points (in hours) was measured by ELISA. (E) Cohorts of control and ATG5-mϕKO each on the ApoE-null background were fed a Western diet for 2 months. Serum IL-1β concentration was analyzed by ELISA. Data are presented as mean ± SEM. *P<0.05 (exact P value shown).
Figure 4
Figure 4. Quantification of Atherosclerosis in the ATG5-mϕKO Autophagy-Deficient Model
(A) Western blot analysis of p62 and β-actin in whole aorta lysates from control (n=4) and ATG5-mϕKO (n=4) mice (ApoE-null background) fed a Western diet for 2 months. Densitometric quantification is shown at right. *P<0.05. (B, C) Cohorts of control and ATG5-mϕKO mice (ApoE-null background, # of mice shown) were fed a Western diet for 2 months and atherosclerotic area involvement was determined by computer image analyses. (B) Oil Red O-stained sections of aortic roots (representative aortic root sections are shown on the right). (C) En face results for the total aorta and its regions (aortic arch, thoracic aorta, and abdominal aorta). Horizontal lines within the data sets represent means. *P<0.05 (exact P value shown), NS = not significant. (D) Cholesterol efflux to apoAI in AcLDL-loaded control and ATG5-mϕKO peritoneal macrophages over a 8, 24, and 48 hour time-course. *P<0.05. (E, F) Cohorts of control and ATG5-mϕKO mice each on the ApoE-null background were fed a Western diet (E) or a chow diet (F) for 2 months. IL-1β concentration from whole aorta lysates was analyzed by ELISA. (G) Western blot analysis of p62 and β-actin in whole aorta lysates from representative chow diet-fed mice with the densitometric quantification shown below. *P<0.05 (exact P value shown), NS = not significant. For all panels, data are presented as mean ± SEM.
Figure 5
Figure 5. Inflammasomes are Synergistically Activated by Cholesterol Crystals and are Characteristic of Autophagy-Deficient Macrophages
Experiments in (A–E) utilized cultured thioglycollate-elicited peritoneal macrophages from control vs. ATG5-mϕKO mice (A–C,E) or ATG7-mϕKO mice (D). (A) Macrophages were treated with or without LPS (100 ng/ml) for 12 hours. Western blot analysis of pro-caspase-1 and pro-IL-1β from macrophage cell lysates (top panels) and the cleaved/activated forms of caspase-1 (p10 subunit) and IL-1β secreted into the cell culture medium (lower panels) are shown. Densitometric quantification of Western blots from two separate experiments is shown at right. *P<0.05, NS = not significant. (B) Macrophages were treated with or without LPS (100 ng/ml) or LPS (100 ng/ml)+cholesterol-crystals (CC, 500 µg/ml) for the indicated times (in hours). Cell culture supernatants were assayed for IL-1β concentration by ELISA. Experiments were performed in duplicate. *P<0.05. (C) Macrophages were treated with LPS+cholesterol-crystals for 12 hours and ASC aggregation speck formation was determined by immunofluorescence microscopy. Four representative merged stains of ASC (red “specks”) and DAPI nuclear stains (blue) are shown for control and ATG5-mϕKO macrophages. The percentage of cells staining positive for ASC is quantified on the right. (D) Control and ATG7-mϕKO macrophages were treated with LPS and LPS+cholesterol crystals for 12 hours. Cell culture supernatants were assayed for IL-1β concentration by ELISA. Experiments were performed in duplicate. *P<0.05. (E) Macrophages were treated with LPS+cholesterol crystals for 12 hours in the presence or absence of a caspase-1 inhibitor and cell culture supernatants were assayed for IL-1β concentration by ELISA. Experiments were performed in duplicate. *P<0.05. (F) Bone marrow-derived macrophages from wild-type, NLRP3-null, or ASC-null mice were treated with LPS or LPS+cholesterol crystals for 12 hours and cell culture supernatants were assayed for IL-1β concentration by ELISA. Experiments were performed in duplicate. *P<0.05. For all panels, data are presented as mean ± SEM.
Figure 6
Figure 6. Increased Cholesterol Crystal Burden and Reactive Oxygen Species in ATG5-mϕKO Plaques are Potential Mediators of Atherosclerotic Progression
(A) Confocal reflectance microscopy of formaldehyde-fixed frozen-section aortic roots from cohorts of Western diet-fed control and ATG5-mϕKO (ApoE-null background) mice. Plaque cholesterol crystal burden was quantified by computer image analysis. Horizontal lines within the data sets represent means. *P<0.05 (exact P value shown). Reflectance images for a representative area of the aortic root are shown on the right. (B) Western blot analysis of p62, ATG5, β-actin, and LC3 expression in wild type thioglycollate-elicited peritoneal macrophages incubated with cholesterol crystals (500 µg/ml) for the indicated times (in hours). (C) Determination of protein oxidation in Western diet-fed control and ATG5-mϕKO (ApoE-null background) whole aortic lysates using the OxyBlot™ immunoblot detection assay. Densitometric analysis of control (n=3) and ATG5-mϕKO (n=3) mice is also shown. *P<0.05. (D) The use of another oxidative stress marker, Dihydroethidium (DHE)-staining, in representative aortic root sections of mice. Higher intensity nuclear fluorescence is indicative of increased superoxide levels. For all panels, graphical data are presented as mean ± SEM.
Figure 7
Figure 7. Schematic Depiction of the Links between Autophagy, Inflammasomes, and Atherosclerotic Progression

Comment in

References

    1. Allam AH, Thompson RC, Wann LS, Miyamoto MI, Thomas GS. Computed tomographic assessment of atherosclerosis in ancient Egyptian mummies. JAMA. 2009;302:2091–2094. - PubMed
    1. Bjorkoy G, Lamark T, Brech A, Outzen H, Perander M, Overvatn A, Stenmark H, Johansen T. p62/SQSTM1 forms protein aggregates degraded by autophagy and has a protective effect on huntingtin-induced cell death. J Cell Biol. 2005;171:603–614. - PMC - PubMed
    1. Brown AJ, Mander EL, Gelissen IC, Kritharides L, Dean RT, Jessup W. Cholesterol and oxysterol metabolism and subcellular distribution in macrophage foam cells. Accumulation of oxidized esters in lysosomes. J Lipid Res. 2000;41:226–237. - PubMed
    1. Castro C, Campistol JM, Sancho D, Sanchez-Madrid F, Casals E, Andres V. Rapamycin attenuates atherosclerosis induced by dietary cholesterol in apolipoprotein-deficient mice through a p27 Kip1 -independent pathway. Atherosclerosis. 2004;172:31–38. - PubMed
    1. Chakravarthy MV, Pan Z, Zhu Y, Tordjman K, Schneider JG, Coleman T, Turk J, Semenkovich CF. "New" hepatic fat activates PPARalpha to maintain glucose, lipid, and cholesterol homeostasis. Cell Metab. 2005;1:309–322. - PubMed

Publication types

MeSH terms