. 2012 Jul 16;61(4):1129-42.
doi: 10.1016/j.neuroimage.2012.03.021. Epub 2012 Mar 13.

A convergent functional architecture of the insula emerges across imaging modalities

Affiliations

A convergent functional architecture of the insula emerges across imaging modalities

Clare Kelly et al. Neuroimage. .

Abstract

Empirical evidence increasingly supports the hypothesis that patterns of intrinsic functional connectivity (iFC) are sculpted by a history of evoked coactivation within distinct neuronal networks. This, together with evidence of strong correspondence among the networks defined by iFC and those delineated using a variety of other neuroimaging techniques, suggests a fundamental brain architecture detectable across multiple functional and structural imaging modalities. Here, we leverage this insight to examine the functional organization of the human insula. We parcellated the insula on the basis of three distinct neuroimaging modalities - task-evoked coactivation, intrinsic (i.e., task-independent) functional connectivity, and gray matter structural covariance. Clustering of these three different covariance-based measures revealed a convergent elemental organization of the insula that likely reflects a fundamental brain architecture governing both brain structure and function at multiple spatial scales. While not constrained to be hierarchical, our parcellation revealed a pseudo-hierarchical, multiscale organization that was consistent with previous clustering and meta-analytic studies of the insula. Finally, meta-analytic examination of the cognitive and behavioral domains associated with each of the insular clusters obtained elucidated the broad functional dissociations likely underlying the topography observed. To facilitate future investigations of insula function across healthy and pathological states, the insular parcels have been made freely available for download via http://fcon_1000.projects.nitrc.org, along with the analytic scripts used to perform the parcellations.


Figures

Figure 1
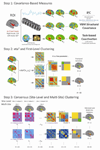
Figure 1. Analysis schematic
Step 1: Covariance-Based Measures. Starting with ROIs comprising the right (134 voxels) and left (117 voxels) insula, per the Harvard-Oxford atlas that accompanies FSL (25% probability, resampled to 4×4×4mm voxels), we computed whole-brain intrinsic functional connectivity (iFC), grey-matter structural covariance, and task-based coactivation, for each voxel (v1,…,vn) within each ROI (n=134 for the right insula; n=117 for the left insula). Step 2: eta2 and First-Level Clustering. For each covariance measure we used eta2 to quantify the similarity between every pair of covariance maps, producing a set of 134×134 matrices containing 8911 unique eta2 values ranging between 0 and 1 for the right hemisphere; and a set 117×117 matrices containing 6786 unique eta2 values for the left. We then used spectral clustering (Meila and Shi, 2001) to partition the insula into clusters of voxels maximizing intra-cluster/minimizing inter-cluster similarity. This produced three sets of clustering solutions for K = 2,…,15, one for each covariance measure. Step 3: Consensus (Site-Level and Multi-Site) Clustering. Where more than one set of clustering solutions is available, it is possible to apply a stability or consensus clustering approach to derive clustering solutions that are stable across instances. For the iFC data, two levels of consensus clustering were possible – one that derived 20 sets of site-level clustering solutions that were stable across individuals within each site, and a second that derived a single set of clustering solutions that were stable across data collection sites. For the structural covariance data, only one level of consensus clustering was possible – the one that captured stable solutions across data collection sites. Because the task coactivation data produced only a single set of clustering solutions at the first level, no consensus clustering was possible for those data. All the scripts used to perform the multisite consensus clustering analysis are available via http://fcon_1000.projects.nitrc.org.
Figure 2
Figure 2. Consensus clustering schematic for K = 2
The schematic illustrates the consensus clustering process. For each scale K, each clustering instance contributes an adjacency matrix A(s), each element aij(s) of which contains a value of 1 if voxels i and j are assigned to the same cluster k, and 0 otherwise. In this example, let each instance be a data collection site, so A(1) is contributed by Bangor; A(2) is contributed by Berlin, etc. A consensus matrix A(S̅) is derived by averaging across adjacency matrices. Each element of the consensus matrix thus contains a number between 0 and 1, corresponding to the proportion of times a given pair of voxels appeared in the same cluster, across instances (here, data collection sites). The spectral clustering algorithm can then be applied to identify the most stable pattern of cluster assignments across instances, using the same scale K that was used to generate the consensus matrix (here, K = 2).
Figure 3
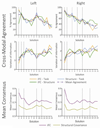
Figure 3. Clustering metrics
We identified optimal clustering solutions on the basis of their cross-modal correspondence. For each value of K, we compared the cluster solutions generated for each modality using Percent Agreement (top two panels) and Variation of Information (VI; middle two panels). We selected the values of K showing the highest mean Percent Agreement or lowest mean VI (purple dashed lines), across the three different pairings of the three modalities. In addition to strong agreement for the trivial K = 2 solutions, these metrics indicated that strong agreement was obtained for K = 2, 3, 4 and 9 (left hemisphere), and 3, 5, 6, 7 and 9 (right hemisphere). The bottom two panels show, for iFC and structural covariance, the mean intra-cluster consensus (stability) values for each K. The locations of peaks in the Mean Consensus (K = 2, 4, 9, and 11, left hemisphere; K = 2, 9, and 12, right hemisphere) plots show good correspondence with the locations of peaks in the Agreement plots, suggesting that the solutions showing the best agreement across modalities also exhibited the strongest stability, across data collection sites.
Figure 4
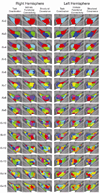
Figure 4. Final cluster solutions
Consensus/multi-site cluster solutions for K = 2,…,15 for the structural covariance, intrinsic functional connectivity (iFC) and task-based coactivation data.
Figure 5
Figure 5. Behavioral domain analysis
Significant behavioral domains (and subdomains) identified for K = 2, 4 and 9 (left hemisphere), and 2, 5 and 9 (right hemisphere). Domains and subdomains exceeding an uncorrected threshold of p < 0.05 but not the Bonferroni threshold are in italics. Distributions for each domain and cluster are shown in Supplemental Figures S13–S18.

References

    1. Ackermann H, Riecker A. The contribution(s) of the insula to speech production: a review of the clinical and functional imaging literature. Brain Struct Funct. 2010;214:419–433. - PubMed
    1. Adolphs R, Tranel D, Damasio AR. Dissociable neural systems for recognizing emotions. Brain Cogn. 2003;52:61–69. - PubMed
    1. Anderson JS, Druzgal TJ, Lopez-Larson M, Jeong EK, Desai K, Yurgelun-Todd D. Network anticorrelations, global regression, and phase-shifted soft tissue correction. Hum Brain Mapp. 2011;32:919–934. - PMC - PubMed
    1. Augustine JR. Circuitry and functional aspects of the insular lobe in primates including humans. Brain Res Brain Res Rev. 1996;22:229–244. - PubMed
    1. Bellec P, Rosa-Neto P, Lyttelton OC, Benali H, Evans AC. Multi-level bootstrap analysis of stable clusters in resting-state fMRI. Neuroimage. 2010;51:1126–1139. - PubMed

Publication types

MeSH terms