. 2012 Apr;16(4):207-18.
doi: 10.1016/j.tics.2012.03.005. Epub 2012 Mar 20.

Cognit activation: a mechanism enabling temporal integration in working memory

Affiliations

Cognit activation: a mechanism enabling temporal integration in working memory

Joaquín M Fuster et al. Trends Cogn Sci. 2012 Apr.

Abstract

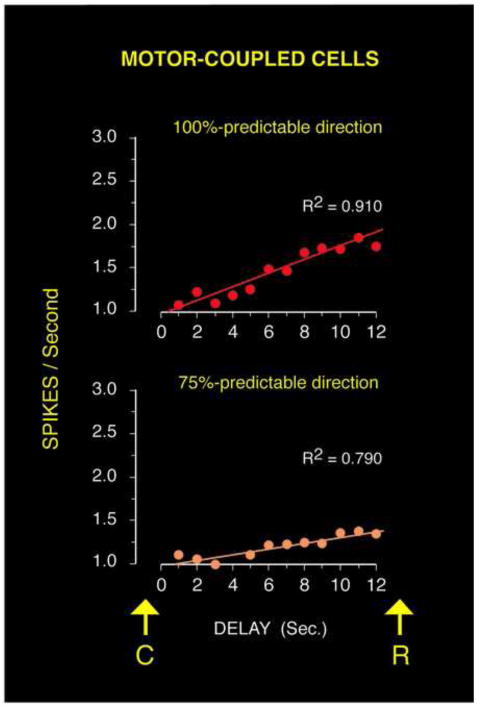
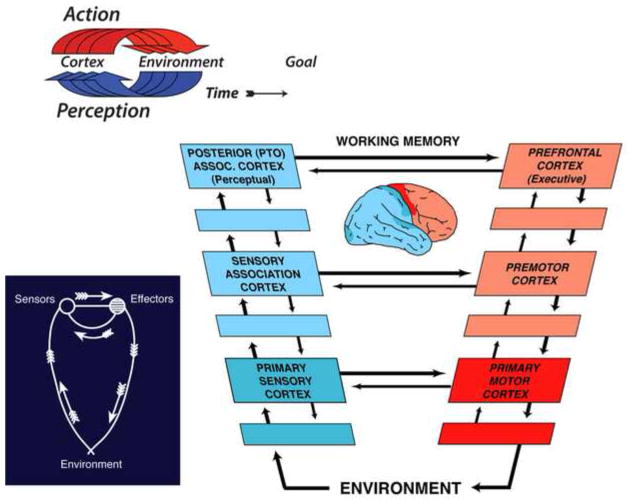
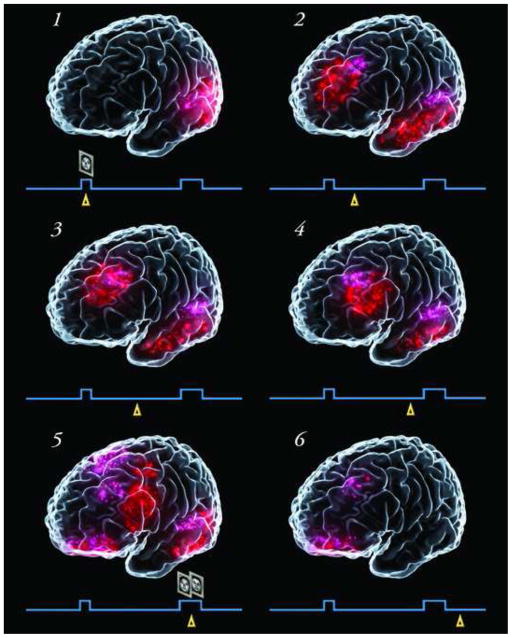
Working memory is critical to the integration of information across time in goal-directed behavior, reasoning and language, yet its neural substrate is unknown. Based on recent research, we propose a mechanism by which the brain can retain working memory for prospective use, thereby bridging time in the perception/action cycle. The essence of the mechanism is the activation of 'cognits', which consist of distributed, overlapping and interactive cortical networks that in the aggregate encode the long-term memory of the subject. Working memory depends on the excitatory reentry between perceptual and executive cognits of posterior and frontal cortices, respectively. Given the pervasive role of working memory in the structuring of purposeful cognitive sequences, its mechanism looms essential to the foundation of behavior, reasoning and language.


Figures

Figure 1
Figure 1. Hierarchical organization of cognits in the cerebral cortex
Perceptual cognits are organized hierarchically between primary sensory areas (blue) and posterior association cortex (white) by order of category of perceptual memory, from phyletic sensory memory (sensory cortex) at the bottom to conceptual perceptual knowledge at the top. Executive cognits are organized hierarchically between primary motor cortex (red) and prefrontal cortex (white) by order of category of executive memories, from phyletic motor memory (motor cortex) at the bottom to conceptual executive knowledge at the top. Lower figure: Lateral view of the left hemisphere, areas numbered according to Brodmann’s cytoarchitectonic map. RF: Rolandic fissure. Upper figure: Schematic hierarchical order of perceptual and executive cognits. Bidirectional arrows indicate cortico-cortical connectivity: perceptual (dark blue), executive (red), and perceptual-executive (green). The inverted triangles symbolize the divergence of connections and increased size of cognits with ascending hierarchical order. From [16], modified, with permission.
Figure 2
Figure 2. Frequency of cortical oscillation in WM as a function of memorandum
The x-axis represents time relative to start of 4s delay period, and y-axis represents logarithmically scaled frequencies. Separate plots are shown for the electrode clusters shown by red dots in scalp diagrams. Time-frequency spectrograms show difference in oscillatory power between correct-order trials and correct-item trials in a delayed matching task. Color scale at right: Hot colors denote relative increases in oscillatory power during trials in which the subject is requested to memorize order; cool colors denote relative increases of oscillatory power during trials in which the subject is requested to memorize item. Upper figure (six panels): Spectrograms in correct-performance trials. Note higher frontal theta power in order trials and higher alpha power in item trials. Lower figure (four panels): Comparison of spectra between high-performance and low-performance trials of both kinds (order and item). A and C: High performance. B and D: Low performance. Note reciprocal power changes as a function of performance-level. From [49], with permission.
Figure 3
Figure 3. Average discharge of motor-coupled cortical cells during the memory period (delay) of a visual WM task
In this task, the memoranda are colors, which connote differences in probability (i.e., predictability) of the required manual response at the end of the trial, to the left or to the right. C, color cue (memorandum); R, manual response. From [84], modified, with permission.
Figure 4
Figure 4. Computational model of WM
Above: The model’s essential architecture, with four recurrent networks (cognits A, B, C, and D) in four separate regions of the cortex; recurrent loops are marked by C’s with letter subscripts denoting interactive cognits. I (t), inputs. Below: Three types of temporal memory discharge by units in the model and by real cortical cells recorded from monkeys in the laboratory of the first author. The frequency histograms are time-locked with presentation of the memorandum. From [57], modified, with permission.
Figure 5
Figure 5. The perception/action cycle
Upper left: Basic diagram of the PA cycle toward a goal through cortex and environment. Lower left: Basic diagram of the sensory-motor cycle from Von Uexküll [58], with the internal nervous feedback from efferents to sensors. Right: General view of the connective framework of the PA cycle in the primate cortex. Blank rectangles stand for subareas or intermediate areas. Arrows indicate direction of anatomically verified connections. Large arrows, running clockwise, constitute the major functional processing links of the cycle through the perceptual and executive cognitive hierarchies. Smaller arrows, counterclockwise, constitute internal cortico-cortical feedback. Feed-forward and feedback reentry between prefrontal and posterior association cortex (PTO, parietal-temporal-occipital), at the top of the cycle, engage those cortices in integrative cognitive functions such as the maintenance of WM.
Figure 6
Figure 6. Neuroimaging of WM
Graphic meta-analysis of visual WM trials in studies with a visual memorandum (e.g., a face on a screen). The delay or memory period (arbitrarily adjusted to 20s) occurs between two deflections of the time line (blue), one marking the sample and the other the choice period. Cortical activation (red) relative to baseline at six moments (yellow triangles) of the task: 1. Memorandum (sample face); 2. Early delay; 3. Mid-delay; 4. Late delay; 5. Response (choice of face); and 6. Post-trial period. The panels result from a graphic (not quantitative) meta-analysis of several studies (some cited in Table 1) and a superposition of activation clusters depicted in those studies. Note the concomitant activation of prefrontal and inferotemporal areas during the delay. From [7], with permission.

References

    1. Lashley KS. In search of the engram. Symp Soc Exp Biol. 1950;4:454–482.
    1. Hebb DO. The Organization of Behavior. John Wiley & Sons; New York: 1949.
    1. Hayek FA. The Sensory Order. University of Chicago Press; Chicago: 1952.
    1. Bressler SL, Menon V. Large-scale brain networks in cognition: emerging methods and principles. Trends Cogn Sci. 2010;14:277–290. - PubMed
    1. Bassett DS, Gazzaniga MS. Understanding complexity in the human brain. Trends Cogn Sci. 2011;15:200–209. - PMC - PubMed